We’ll add more market news briefs throughout the day. Check back to read the latest.
Most recent market news:Mortgage Bankers Association’s Mortgage Credit Availability Index
The MCAI increased 3.2 percent to 183.4 in March. A decline in the MCAI indicates that lending standards are tightening, while increases in the index are indicative of loosening credit. Of the four component indices, the Jumbo MCAI saw the greatest increase in availability over the month (up 11.7 percent), followed by the Conventional MCAI (up 4.5 percent), and the Government MCAI (up 2.3%). The Conforming MCAI decreased 2.6 percent.
“Credit availability increased in March driven by increased availability of Jumbo loan programs and Government loan programs,” said Lynn Fisher, MBA’s Vice President of Research and Economics in a statement. “Led by a wave of adjustable rate Jumbo offerings, the Jumbo MCAI surged in March, more than offsetting its 4.4 percent decline in February, which was the first tightening of the that component index in 11 months.
“Increases observed in the Government MCAI were driven by increased availability of FHA’s Streamline Refinance and 203 K home rehabilitation loan programs.”
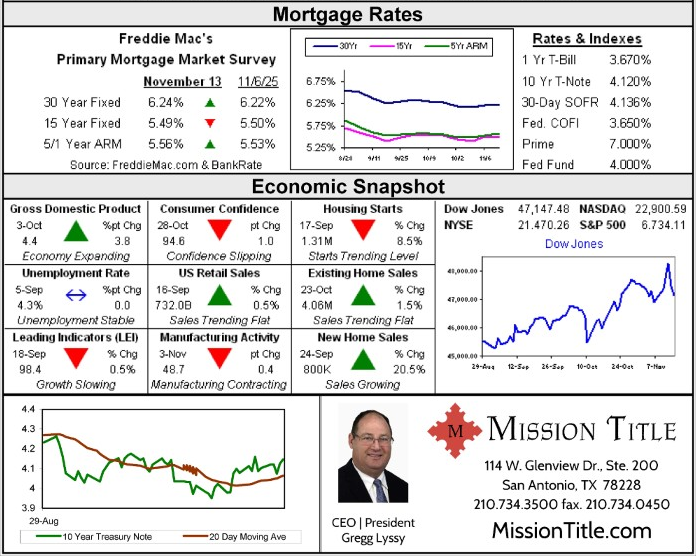
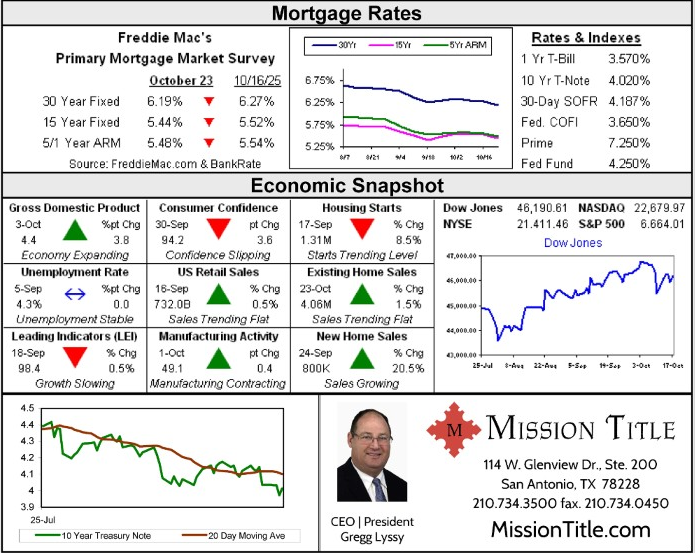
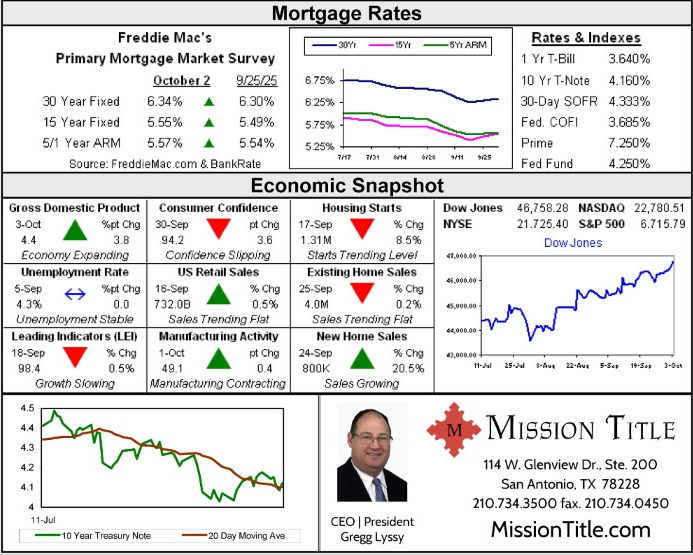
Freddie Mac Primary Mortgage Survey

ADP National Employment Report March 2017
Private-sector employment increased by 263,000 from February to March, on a seasonally adjusted basis.

Attom Data Solutions: 2016 property tax analysis
States with the highest effective property tax rates were New Jersey (2.31 percent), Illinois (2.13 percent); Texas (2.06 percent); New Hampshire (2.03 percent); and Vermont (2.02 percent). States with the lowest effective property tax rates were Hawaii (0.32 percent); Alabama (0.48 percent); Colorado (0.52 percent); Tennessee (0.54 percent); and Delaware (0.56 percent). Among 586 counties with a population of at least 100,000 and at least 10,000 single family homes, nine posted average annual property taxes of more than $10,000: Westchester, Rockland, and Nassau counties in New York; Essex, Bergen, Union and Morris counties in New Jersey; Marin County, California; and Fairfield County, Connecticut. Owner-occupied properties register higher effective tax rate than investment properties The average annual property tax for owner-occupied single family homes nationwide was $3,658, an effective tax rate of 1.21 percent. That was higher than the average annual property tax of $2,437 and effective tax rate of 1.03 percent on non-owner occupied (investment) homes. Home equity rates: Average Home Equity Loan Bank Rates by State | Credio Average Home Equity Loan Bank Rates by State | Credio Average Home Equity Loan Credit Union Rates by State | Credio Mortgage rates: 30-Year Fixed Rate Mortgage Rates for the Past 6 Months | CredioEmail market reports to press@inman.com.
Source: click here


