Check Inman every day for the daily version of this market roundup.
Mortgage rates: 30-Year Fixed Rate Mortgage Rates for the Past 6 Months | Credio 15-Year Fixed Rate Mortgage Rates for the Past 6 Months | Credio Home equity rates: Average Home Equity Loan Bank Rates by State | Credio Average Home Equity Loan Credit Union Rates by State | CredioThursday, June 2:
Freddie Mac’s Primary Mortgage Market Survey:
The 30-year fixed-rate mortgage (FRM) averaged 3.66 percent with an average 0.5 point for the week ending June 2, 2016. This was up from last week when it averaged 3.64 percent. A year ago at this time, the 30-year FRM averaged 3.87 percent.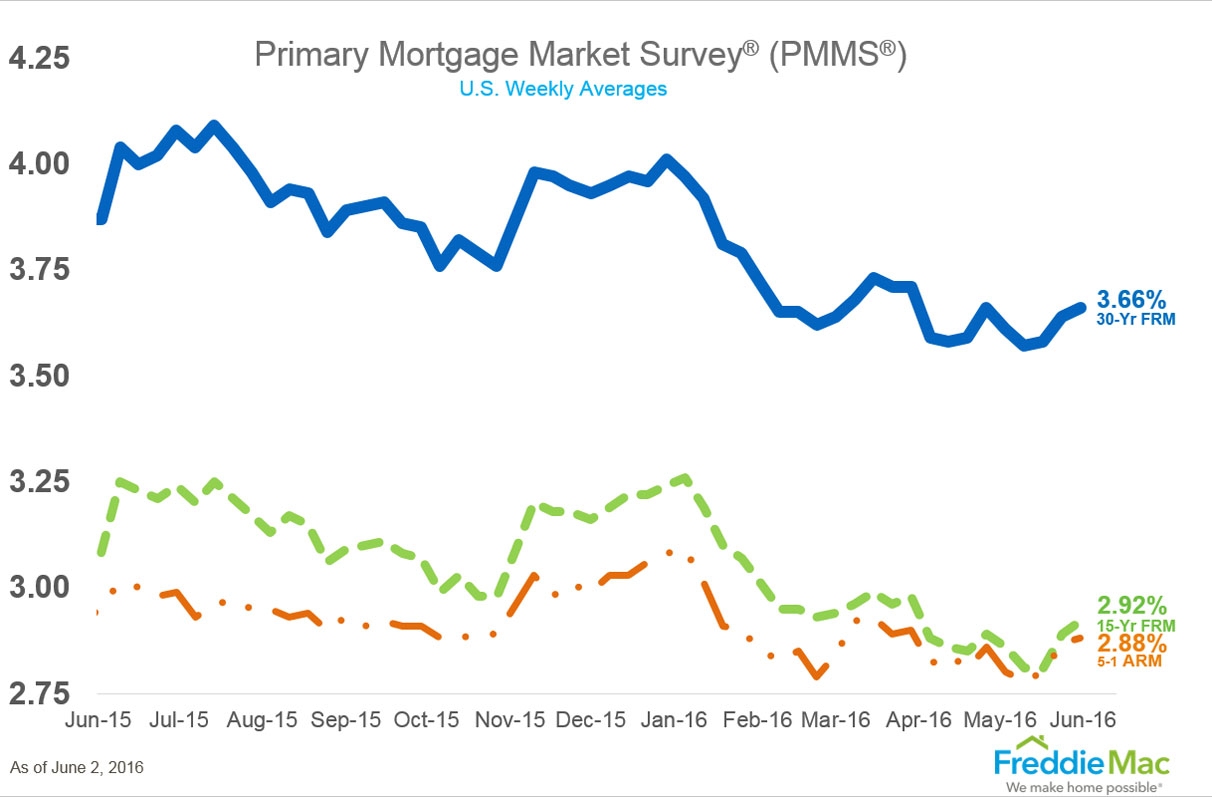
Mortgage Bankers Association’s Mortgage Credit Availability Index (MCAI):
The MCAI fell to 121.1 in May 2016, indicating that lending standards are tightening. Month-over-month, it was down 0.8 percent. Of the four component indices, the Jumbo MCAI saw the greatest tightening (down 1.3 percent) over the month followed by the Government MCAI (down 1.0 percent), the Conventional MCAI (down 0.8 percent), and the Conforming MCAI (down 0.3 percent).
Wednesday, June 1:
Mortgage Bankers Association’s Weekly Applications Survey:
The Market Composite Index, a measure of mortgage loan application volume, decreased 4.1 percent on a seasonally adjusted basis from one week earlier. The refinance share of mortgage activity increased to 54.3 percent of total applications from 53.7 percent the previous week. The average contract interest rate for 30-year fixed-rate mortgages with conforming loan balances ($417,000 or less) remained unchanged at 3.85 percent, with points decreasing to 0.36 from 0.37 (including the origination fee).U.S. Census Bureau’s April 2016 construction spending:
Construction spending during April 2016 was at a seasonally adjusted rate of $1,133.9 billion. This is 1.8 percent below the revised March estimate of $1,155.1 billion. It’s 4.5 percent above the April 2015 estimate of $1,085.0 billion.Tuesday, May 31:
Ten-X’s Residential Real Estate Nowcast for May 2016:
May existing home sales will fall between seasonally adjusted annual rates of 5.47 and 5.83 million, with a targeted number of 5.65 million. This is a 3.7 percent increase from April 2016. It also represents a 6.2 percent year-over-year gain.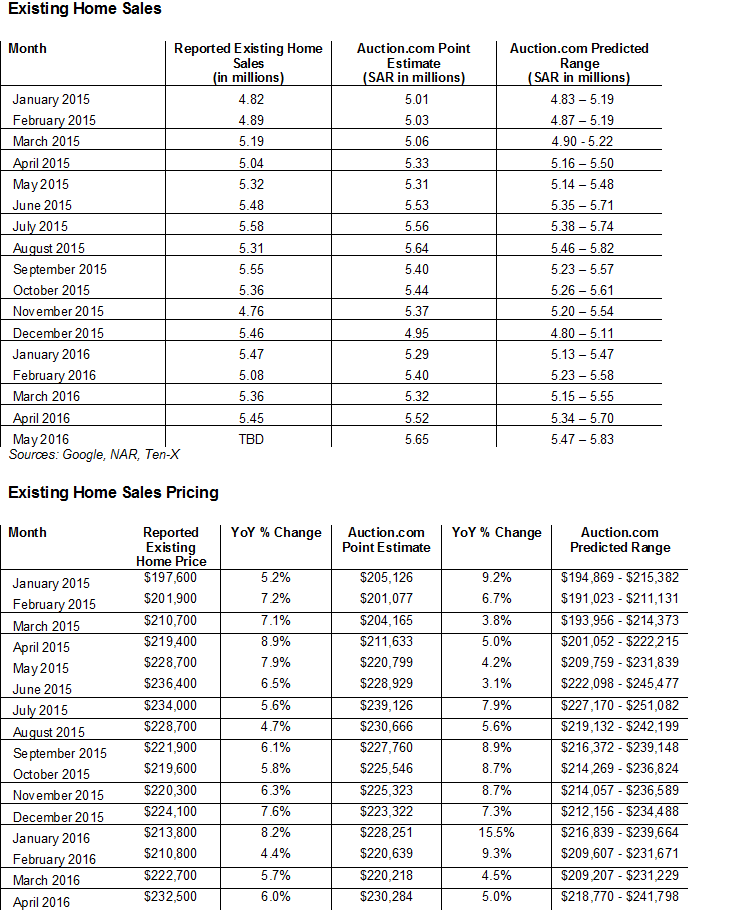
S&P/Case-Shiller Home Price Index for March 2016:
The national index was at 176.91. This is up 0.72 percent month-over-month. In March 2015, the index was 168.24.Black Knight Home Price Index for March 2016:
The home price index in the United States was $257,000. This is up 1.2 percent from February 2016. It’s also up 5.3 percent from March 2015.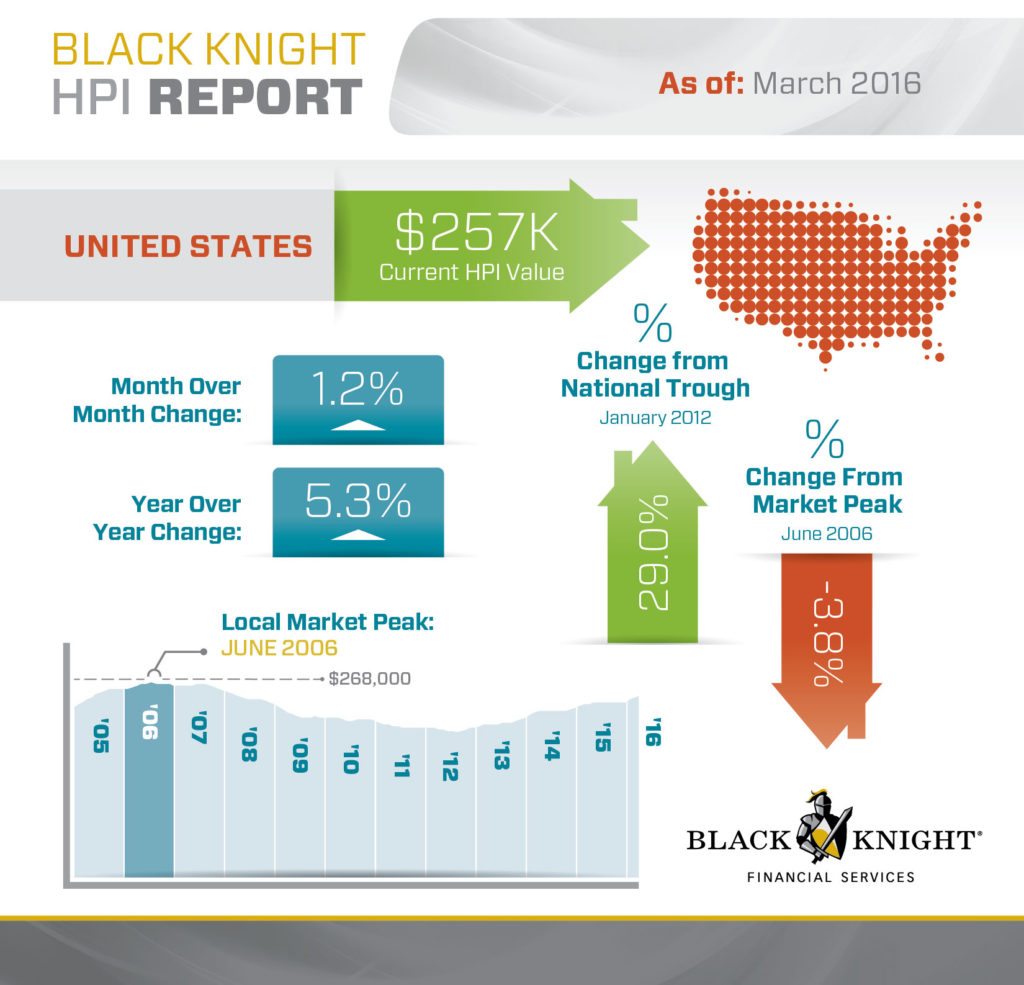
Email market news to press@inman.com.
Source: click here


