In the current housing market, first-time homebuyers often get the short end of the stick — they’re more likely to be on the hunt for lower-priced starter homes, which have already been snatched up for use as single-family rentals or are occupied by homeowners unwilling to enter a volatile housing market.
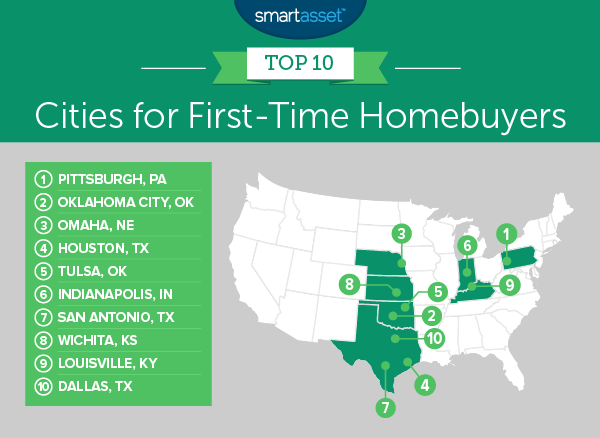
But not all hope is lost, as proven in SmartAsset’s latest affordability report, which outlines the 10 most affordable cities for aspiring homeowners. The cities, which were evaluated on seven factors such as average price-per-square-foot, affordability ratio, stability score and price variance, are primarily located in the South and Midwest, two regions that have experienced little price growth thanks to healthy residential housing starts, strong economies and jobs growth and an overall lower cost of living.
1. Pittsburgh, Pennsylvania
Pittsburgh’s PNC Park | Photo by Joshua Peacock on Unsplash
Pittsburgh reigned supreme on SmartAsset’s list thanks to affordable home prices that break down to an average price-per-square-foot of $91 — the 13th-lowest among the 64 cities included in the analysis.
Beyond the opportunity to save some cash, SmartAsset said homes in Pittsburgh tend to retain their value. The city had zero quarters of negative growth between 2012 and 2017.
 Enter Web 3.0: Blockchain and the global MLS
How blockchain is revamping the real estate industry READ MORE
2. Oklahoma City, Oklahoma

Downtown Oklahoma City | Photo by Gerson Repreza on Unsplash
Oklahoma City came in at no. 2 on the list with zero quarters of negative growth over a five-year period, and an average price-per-square-foot of $83.75.
But first-time buyers in Oklahoma City should keep an eye on home costs, property taxes (1.064 percent), homeowners insurance and closing costs ($5,833 for a $200k home), all of which often catch newbies by surprise. When these factors are considered and compared with the average household income, the city falls to no. 12.
3. Omaha, Nebraska
Gene Leahy Mall in Omaha | Photo by John Matychuk on Unsplash
Omaha rounded out the top three with the highest loan-funding ratio. Eighty-two percent of buyers who applied for a conventional home loan had their mortgage processed, meaning that first-time buyers don’t have to worry about not finding or being denied a loan.
The average price-per-square-foot is $113.08 and market volatility (the standard deviation of annual price change each quarter) is 2 percent.
4. Houston, Texas
Downtown Houston | Photo by Vlad Busuioc on Unsplash
Houston ranked fourth and is one of three Texas cities to make the list, making Texas one of the best states for first-time buyers overall.
What stood out about H-Town were the 227 HUD-approved mortgage lenders in the city, the most of any metro included in the analysis. Houston can also boast about zero quarters of negative growth and an average price-per-square-foot of $87.50.
5. Tulsa, Oklahoma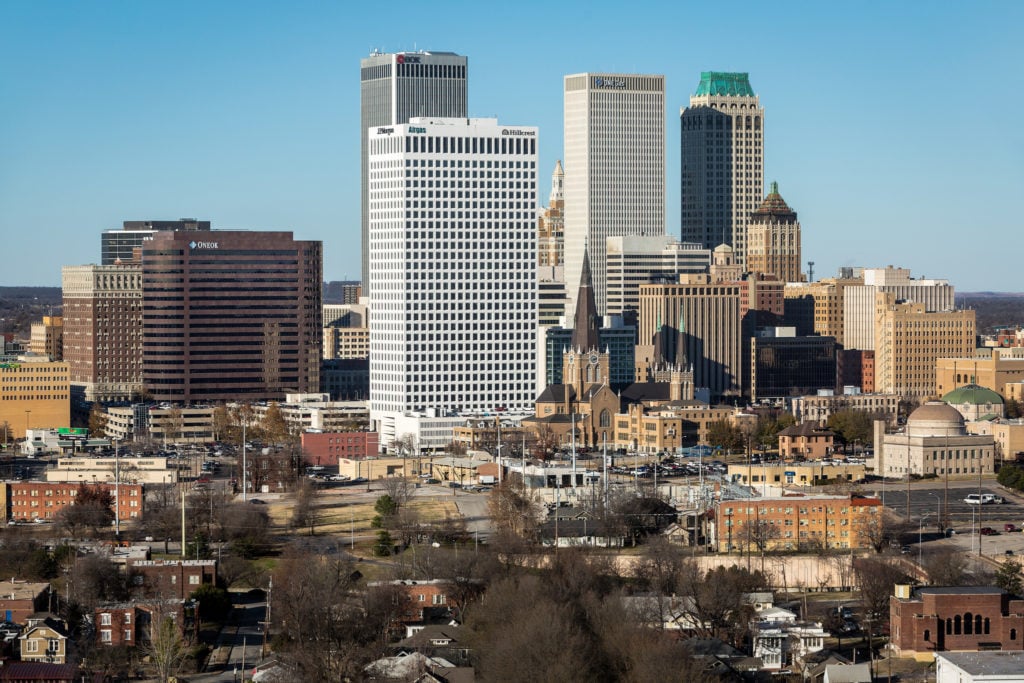
Tulsa’s Central Park | Photo by Barry Lenard on Flickr Creative Commons
Tulsa, which came in fifth, has the same problem as it’s neighbor to the south, Oklahoma City. Although Tulsa has one of the cheapest average price-per-square-foot ($77.75), the average household income isn’t enough to keep up, especially when other home-related costs and taxes are factored in.
According to SmartAsset, Tulsa has a five-year income-to-housing-costs ratio of 4.8.
Indianapolis, Indiana; San Antonio, Texas; Wichita, Kansas; Louisville, Kentucky; and Dallas, Texas, shored up the end of the pack with an average price-per-square-foot ranging from $74.33 (Indianapolis) to $100.67 (Louisville).
Much like Houston, San Antonio and Dallas have a plethora of HUD-approved lenders (154 and 187, respectively) and buyers can be assured about the long-term value of their home as San Antonio only had one quarter of negative growth from 2012 to 2017 (Dallas had none).
Wichita made the list thanks to an 82 percent conventional mortgage processing rate and third-highest income-to-housing-costs ratio. Louisville made the list due to having the 15th-highest mortgage funding ratio (76 percent).
About the listTo find the best cities for first-time homebuyers, SmartAsset collected data for every U.S. city with a population of over 300,000. In total, we looked at 64 cities and ranked them across the following seven metrics: the number of HUD-approved lenders, loan funding ratio, average price-per-square-foot, affordability ratio, stability score, price variance and the number of negative quarters from the first quarter of 2012 to the fourth quarter of 2017. To create our final score, we ranked each city in each metric. Then we found each city’s average ranking, giving equal weighting to each metric. We used this average ranking to create our final score. The city with the best average ranking received a 100. The city with the worst average ranking received a 0.
Source: click here


