For the first time in 12 months, year-over-year gains in home prices fell below six percent, according to the latest S&P CoreLogic Case-Shiller National Home Price NSA Index, announced Tuesday.
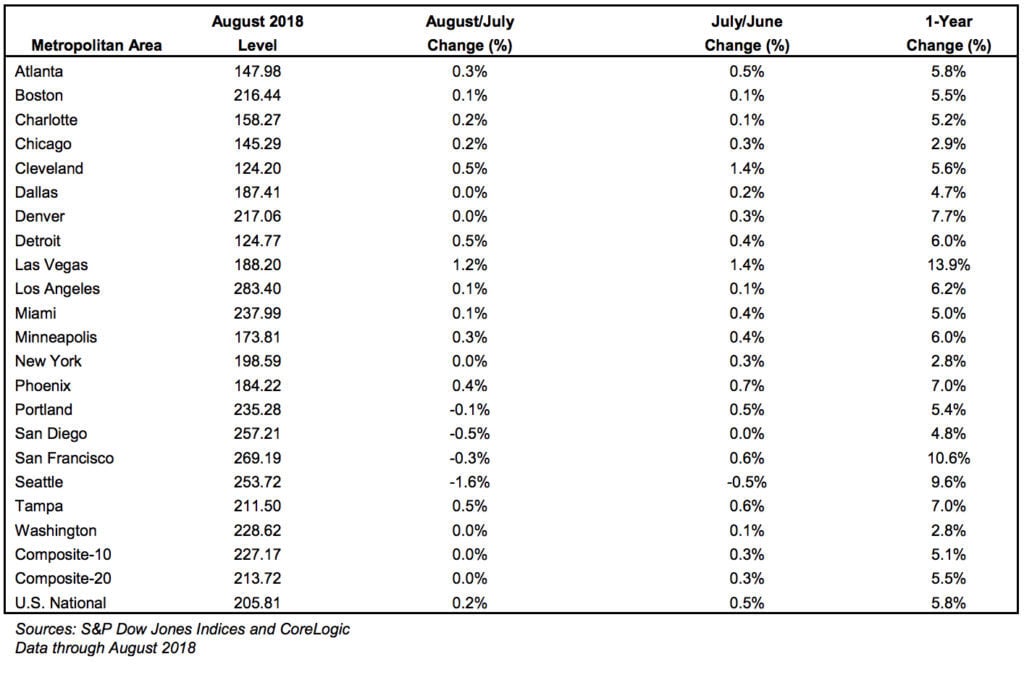
Case-Shiller’s index rose 5.8 percent from August 2017 to August 2018, down from last month’s annual gain of 6 percent.
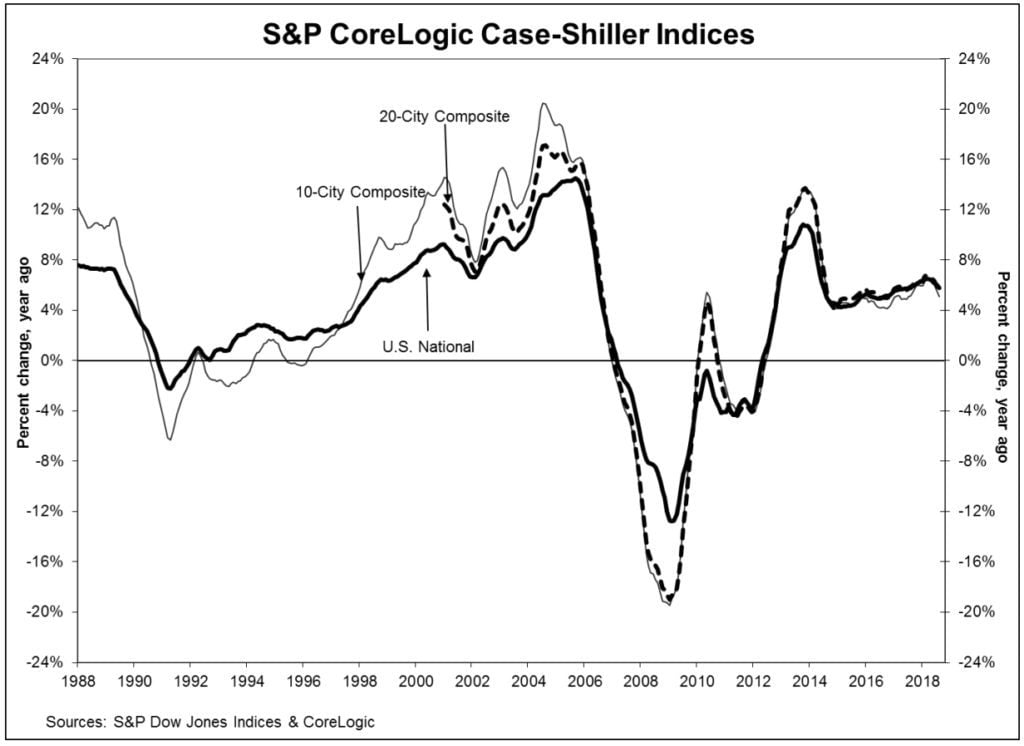 “Following reports that home sales are flat to down, price gains are beginning to moderate,” David M. Blitzer, managing director and chairman of the index committee at S&P Dow Jones Indices, said. “Other housing data tell a similar story: prices and sales of new single-family homes are weakening, housing starts are mixed and residential fixed investment is down in the last three quarters.”
Gains in home price growth deaccelerated for the fifth straight month, showing signs that the market is slacking, according to Cheryl Young, Trulia’s senior economist.
“Home buyers have yet to feel the market has tipped to their favor, however, as continued headwinds curb demand: home price growth – though slowing – still outpaced wage growth and mortgage rates hovered at seven-year highs,” Young said. “These challenges for buyers will continue to diminish affordability, taking a bite out of homes sales and exert more downward pressure on home prices.”
Despite the waning price growth gains, Blitzer said we’re not heading towards another housing market collapse.
 Inman announces new Title Sponsor of Inman Connect Las Vegas 2019
Real Estate Webmasters takes the Title spot when Inman moves to a new city READ MORE
“There are no signs that the current weakness will become a repeat of the crisis, however,” Blitzer said. “In 2006, when home prices peaked and then tumbled, mortgage default rates bottomed out and started a three-year surge.”
“Today, the mortgage default rates reported by the S&P/Experian Consumer Credit Default Indices are stable,” Blitzer added. “Without a collapse in housing finance like the one seen 12 years ago, a crash in home prices is unlikely.”
Regionally Las Vegas, San Francisco and Seattle reported the highest year-over-year gains among the 20 cities tracked. Las Vegas saw 13.9 percent year-over-year price increases, followed by San Francisco at 10.6 percent and Seattle at 9.6 percent.
 About the Index
The S&P/Case-Shiller U.S. National Home Price Index is a composite of single-family home price indices that is calculated every month; the indices for the nine U.S. Census divisions are calculated using estimates of the aggregate value of single-family housing stock for the time period in question.
The nine divisions are:
New England Middle Atlantic East North Central West North Central South Atlantic East South Central West South Central Mountain PacificCoreLogic serves as the calculation agent for the S&P/Case-Shiller U.S. National Home Price Index.
Developing…
Source: click here


