According to Trulia’s latest market analysis, homebuyers and sellers are finally seeing eye-to-eye when it comes to the sales price.
Market mismatch — the measurement of the price gap between search interest and available listings — has dropped 15 percentage points quarter-over-quarter to an average score of 11.1 (0 being perfectly matched and 100 being completely mismatched). Although this is welcome news for buyers and sellers tired of wrestling back and forth during negotiations, there’s another story behind the decline.
During the same time period, the share of searches for starter homes fell from 31.1 percent to 28.7 percent, while the share of premium home searches ($500,000-plus) edged up to 41.1 percent from 38.4 percent the previous year — a sign that competition will begin to heat up at this end of the market as buyers begin to give up on finding an affordable starter home.
What does this market mismatch mean?“The market mismatch in most places suggests that trade-up and especially starter-homebuyers have felt this pain most acutely, with limited options and lots of competition,” wrote Trulia housing economist Felipe Chacón in the report.
“If you are or have been a starter homeseller recently though, depending on where you live, your experience has likely been easy, with lots of interest in your home and possibly multiple offers to consider.”
“Premium homesellers are less likely to have seen that kind of action with a persistent surplus of inventory relative to search interest,” Chacón added. “These shifts in market mismatch suggest things may be getting a little easier for premium homesellers in the current peak homebuying season as interest has been picking up more quickly than in the starter and trade-up categories.”
 How to stand out from the competition
Tom Ferry explains why it’s crucial to have a USP READ MORE

Source: Trulia
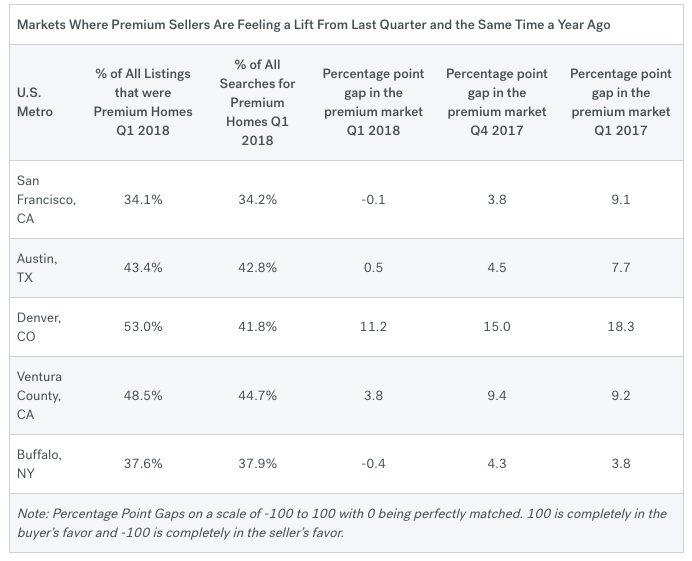
Who’s winning outPremium sellers in Ventura County, California; Austin, Texas; and Buffalo, New York, are benefiting the most from this market shift, as buyers in those areas are increasingly beginning to search for higher-priced homes.
For example, in Q1, 37.6 percent of all listings and 37.9 percent of all searches in Buffalo were for premium homes (great for sellers), but in the previous quarter (Q4 2017), 39.1 percent of listings were for premium homes, and 34.8 percent of search traffic was to them (great for buyers).
On the other hand, not all is lost for buyers — there are some key markets where they can nab an affordable starter or a moderately priced trade-up home.
Philadelphia offers the best options for millennial buyers in particular. The City of Brotherly Love is the 34th most affordable city among the 100 largest metros, and 26.8 percent of all listings in Q1 2018 were considered starter homes, while only 22.7 percent of searches were for these homes.
Millennial buyers are also doing well in San Francisco, where the market mismatch is only at 2.6 (0 is perfectly matched). Searches for starter homes have dipped by 10 percent over the past year, which is a signal of price fatigue. But, Trulia says, buyers in search of a starter home “are now not any worse off than homeshoppers looking in other price tiers.”
MethodologyNote: The calculation for the market mismatch was adjusted from the first three installments of this report. This means the numbers between this installment and the previous one are not directly comparable. However, all the data presented in this report was pulled using the updated method.
Additionally, while the same price cut-offs are used to define starter, trade-up, and premium homes nationally and in the 100 largest U.S. metros as in the quarterly Trulia Price and Inventory Watch, the weights assigned to listings differ, resulting in some differences in the inventory make-up. This different weighting was necessary to ensure that we are only counting site traffic to properties when they are actively on the market.
The Market Mismatch Score was based on all the for-sale listings on Trulia, which were pulled on a quarterly basis beginning in Q1 2016. The distribution of prices for each metro and nationally was calculated by taking each active listing and adding up the number of days it was on the market during the quarter. All unique price points were consolidated and counted by summing these day & price combinations. In other words, if 10 properties were on the market for a combined 600 days at a price of $200,000, then the $200,000 price point would receive a weight of 600.
Site traffic from Trulia was matched to each unique property (and therefore price) on the market during the same time periods and added up for each quarter and price.
Source: click here


