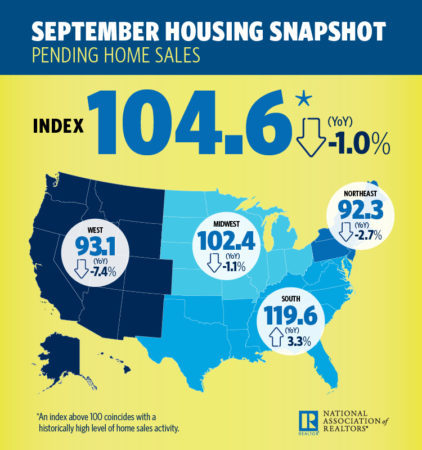
The Pending Home Sales Index rose 0.5 percent, to 104.6, in September, from 104.1 in August, but was still down year-over-year for the ninth-straight month, according to data released Thursday by the National Association of Realtors.
NAR’s chief economist Lawrence Yun said that the small uptick is a good, stabilizing trend, despite the year-over-year decline.
“This shows that buyers are out there on the sidelines, waiting to jump in once more inventory becomes available and the price is right,” Yun said.
 The market’s lack of inventory for moderately priced homes and overall affordability continue to be factors that are hurting the market, according to Yun, but compared to past decades, the affordability climate is still favorable. Specifically when compared to the year 2000 – when the market was considered very healthy and home sales figures were roughly equivalent – the affordability conditions were much lower compared to now, Yun said.
“So even though affordability has been falling recently, the demand for housing should remain steady,” Yun added.
Regionally, the index fell month-over-month in the Northeast and South and rose in the Midwest and West. The index fell year-over-year in all regions but the South.
 Sphere of influence is still king
How to leverage your largest source of real estate business READ MORE
“Lingering weakness from Hurricanes Florence and Michael held pending sales back in the South from last month,” Danielle Hale, the chief economist at realtor.com said. “Pending home sales in the remaining three regions were mixed but the gains in the West and Midwest outweighed the slight decline in the Northeast.”
“However all three regions showed fewer contract signings than one year ago,” Hale added. “These gains are a bellwether for how would-be buyers are reacting to the opposing forces of reduced housing affordability versus a slight increase in the availability of homes for sale.”
The monthly survey compiled by NAR is a forward-looking index of pending home sales based on contracts signed. An index of 100 is based on the level of contract activity during the year 2001, which was the first year NAR examined contract activity.
Source: click here


