Everyone seems to be telling a similar story about their market: Inventory is low, especially for first-time homebuyers — getting buyers into a place that’s perfect for them just isn’t all that easy right now.
So what’s the success rate look like — how many home sales are actually pending, signifying matches made in heaven?
New data from the National Association of Realtors, released this morning, says that May’s pending home sales actually declined year-over-year for the first time in nearly two years. The reason? This competitive seller’s market continues to leave available housing picked over and in a sad state.
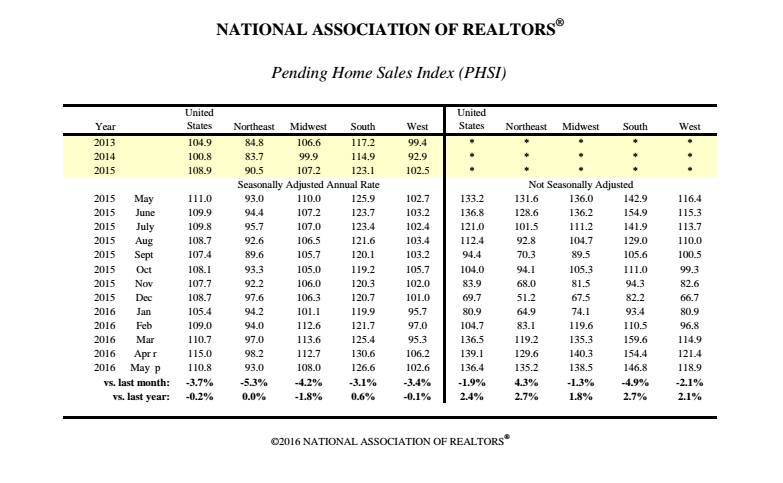
How many home sales are actually pending, signifying matches made in heaven?The index dropped 3.7 percent from a downwardly revised 115.0 in April to 110.8 in May — just 0.2 percent lower than May 2015’s index of 111.0.
This is the first year-over-year decline the market has experienced since August 2014. However, even with the slight slump, the index is still the third highest recorded in the past year.
“With demand holding firm this spring and homes selling even faster than a year ago, the notable increase in closings in recent months took a dent out of what was available for sale in May and ultimately dragged down contract activity,” said NAR Chief Economist Lawrence Yun in a press release. “Realtors are acknowledging with increasing frequency lately that buyers continue to be frustrated by the tense competition and lack of affordable homes for sale in their market.”
Regional breakdownNAR noted in its April PHSI report that pending home sales had reached their highest level in over a decade, with gains in contract signings across all major regions except the Midwest. In May, all four regions saw a decline in pending home sales.
The Northeast witnessed the biggest drop (5.3 percent) to 93.0 in May, an index in line with the region’s PHSI in May 2015. The index declined 4.2 percent in the Midwest to 108.0, which is 1.8 percent down from last year.
In May, all four regions saw a decline in pending home sales.In addition, the West’s index dipped 3.4 percent to 102.6 — 0.1 percent down from a year ago.
Finally, the index in the South may have slipped (3.1 percent to 126.6), but that’s still 0.6 percent up year-over-year.

NAR uses a large national sample of signed residential property sale contracts to build its monthly pending home sales index (PHSI). The sample size typically represents about 20 percent of transactions for existing-home sales.
The index level was benchmarked to 100 in 2001, which was the first year to be examined. Existing-home sales in 2001 were in the 5 million to 5.5 million range, which is considered normal for the population in the U.S.
Further explaining May’s results, Yun added: “Total housing inventory at the end of each month has remarkably decreased year-over-year now for an entire year. There are simply not enough homes coming onto the market to catch up with demand and to keep prices more in line with inflation and wage growth.”
He also described how the fallout from Brexit could both help and hurt the U.S. housing market.
“In the short term, volatility in the financial markets could very likely lead to even lower mortgage rates and increased demand from foreign buyers looking for a safer place to invest their cash,” he added. “On the other hand, any prolonged market angst and further economic uncertainty overseas could negatively impact our economy and end up tempering the overall appetite for homebuying.”
Despite the contract signing slowdown, NAR expects existing-home sales to boost 3.7 percent upward this year to 5.44 million, with existing-home price growth forecasted to hover between 4 and 5 percent.
Like me on Facebook! | Follow me on Twitter!
Source: click here


