Home prices in the U.S. rose 5.5 percent year-over-year in October, the third month in a row of slowing growth, according to the latest Case-Shiller U.S. National Home Price NSA Index released on December 26. The combination of rising home prices and climbing mortgage rates has economists predicting the housing market will stagnate in 2019.
While still not likely to relieve buyers, the 5.5 percent annual growth was the same as in September, and down from 5.7 percent in August.
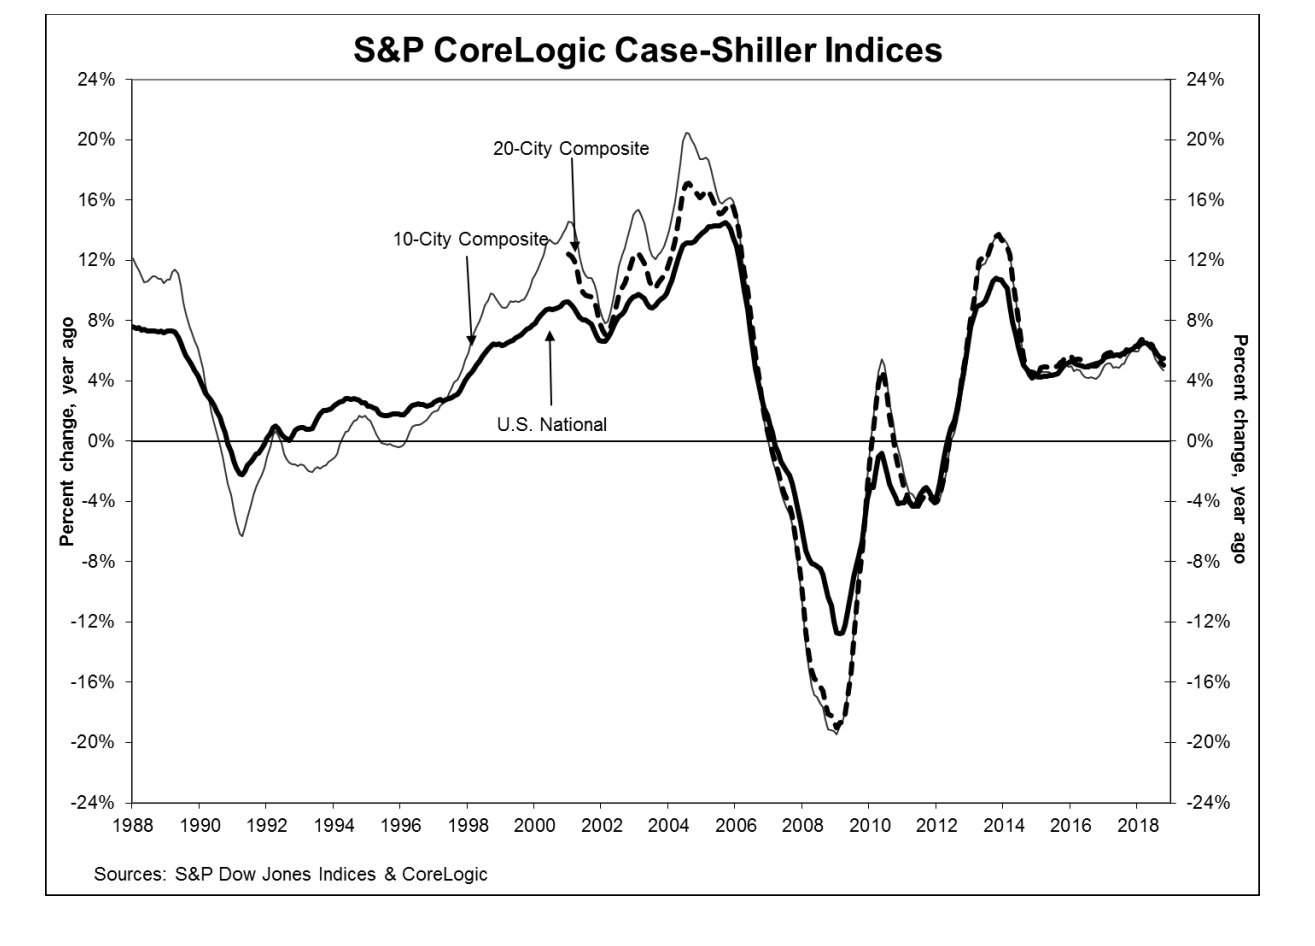
The latest Case-Shiller national home price growth graph for October 2018. (Credit: Case-Shiller/CoreLogic/Dow Jones)
Compared to September 2018, housing prices were up 0.1 percent in October 2018 (before seasonal adjustment).
“Home prices in most parts of the U.S. rose in October from September and from a year earlier,” David M. Blitzer, managing director and chairman of the index committee at S&P Dow Jones Indices said. “The combination of higher mortgage rates and higher home prices rising faster than incomes and wages means fewer people can afford to buy a house.”
Prospective home buyers can no longer sustain the demand that propped up these rising home prices, according to Cheryl Young, senior economist at Trulia.
 Holidays in 3D: Tour 5 festive locations right now
Get inspiration for decorating and staging listings at the most wonderful time of year READ MORE
“Home price growth continues to outstrip wage increases and advancing mortgage rates combine for menacing headwinds that impact affordability,” Young said. “With little sign that home buyers’ purchasing power will strengthen into 2019, expect the housing market to stagnate well into next year.”
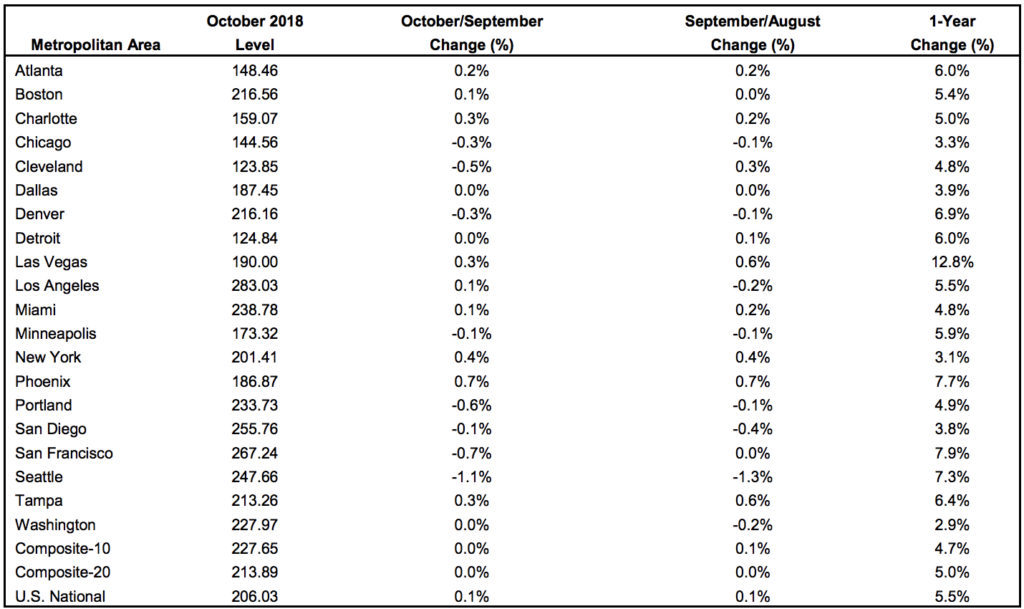
Home price gains broken down by region. (Credit: Case-Shiller/CoreLogic/Dow Jones)
Regionally, Las Vegas, led the way with a 12.8 percent year-over-year increase. San Francisco and Phoenix also saw increases of more than 7.5 percent.
“This is a marked change from the housing collapse in 2006-12 when Las Vegas was the hardest hit city with prices down 62 percent,” Blitzer said. “After the last recession, Las Vegas diversified its economy by adding a medical school, becoming a regional center for health care, and attracting high technology employers.”
About the IndexThe S&P/Case-Shiller U.S. National Home Price Index is a composite of single-family home price indices that is calculated every month; the indices for the nine U.S. Census divisions are calculated using estimates of the aggregate value of single-family housing stock for the time period in question.
The nine divisions are:
New England Middle Atlantic East North Central West North Central South Atlantic East South Central West South Central Mountain PacificCoreLogic serves as the calculation agent for the S&P/Case-Shiller U.S. National Home Price Index.
Source: click here


