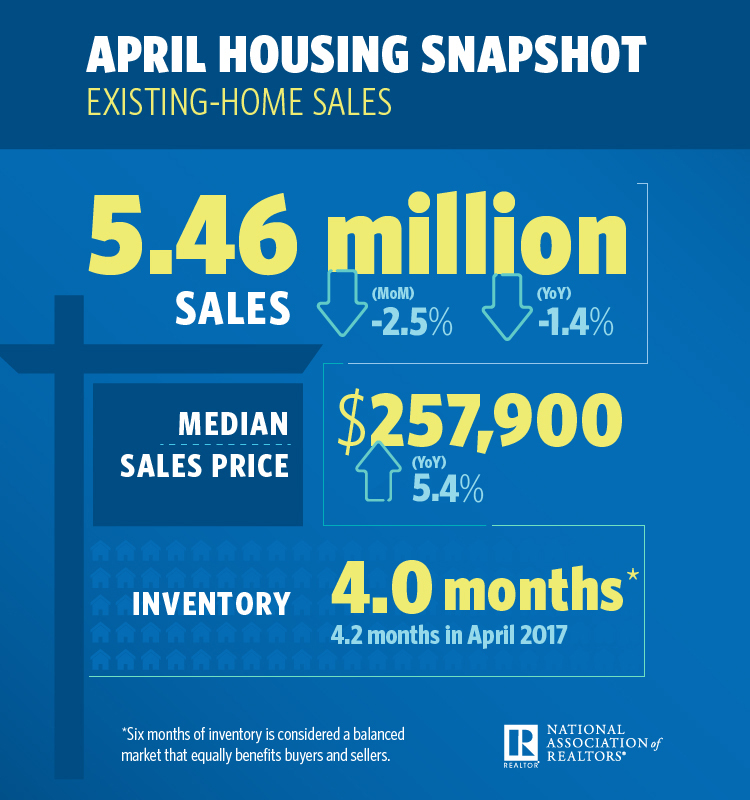
Existing-home sales decreased 2.5 percent to a seasonally adjusted annual rate (SAAR) of 5.46 million in April — down from 5.60 million in March, the National Association of Realtors (NAR) reported today.
This month’s sales pace is 1.4 percentage points below April 2017 and marks the second consecutive month of year-over-year declines.
Once again, low inventory is to blameThe median existing-home price for all housing types rose 5.4 percent to $257,900, making April the 74th month in a row to see year-over-year gains.
Total housing inventory increased 9.8 percentage points month-over-month to 1.80 million homes for sale, while year-over-year inventory dropped 6.3 percentage points. It was the 35th consecutive month of year-over-year declines. Unsold inventory is at a four-month supply at the current sales price.
NAR chief economist Lawrence Yun said the slump in existing-home sales is due to dangerously low inventory levels that are simply unable to meet buyer demand.
 How to stand out from the competition
Tom Ferry explains why it’s crucial to have a USP READ MORE
“The root cause of the underperforming sales activity in much of the country so far this year continues to be the utter lack of available listings on the market to meet the strong demand for buying a home,” Yun said in a statement. “Realtors say the healthy economy and job market are keeping buyers in the market for now even as they face rising mortgage rates.”
“However, inventory shortages are even worse than in recent years, and home prices keep climbing above what many homeshoppers are able to afford.”
Keller Williams chief economist Ruben Gonzalez says buyers are increasingly growing weary of low inventory matched with exorbitant home prices.
“While demand still remains strong, we are hearing about buyers pulling out of deals at the last minute over concerns they are overstretching their budgets and of buyers leaving the market feeling they have been priced out,” Gonzalez said in an emailed statement. “As low inventory continues to drive up prices and mortgage rates rise, we may start to see some pressure on demand.”
“We continue to forecast sales will likely be on par with 2017 on a year-over-year basis, with the most risk being to the downside and associated with mortgage rates.”
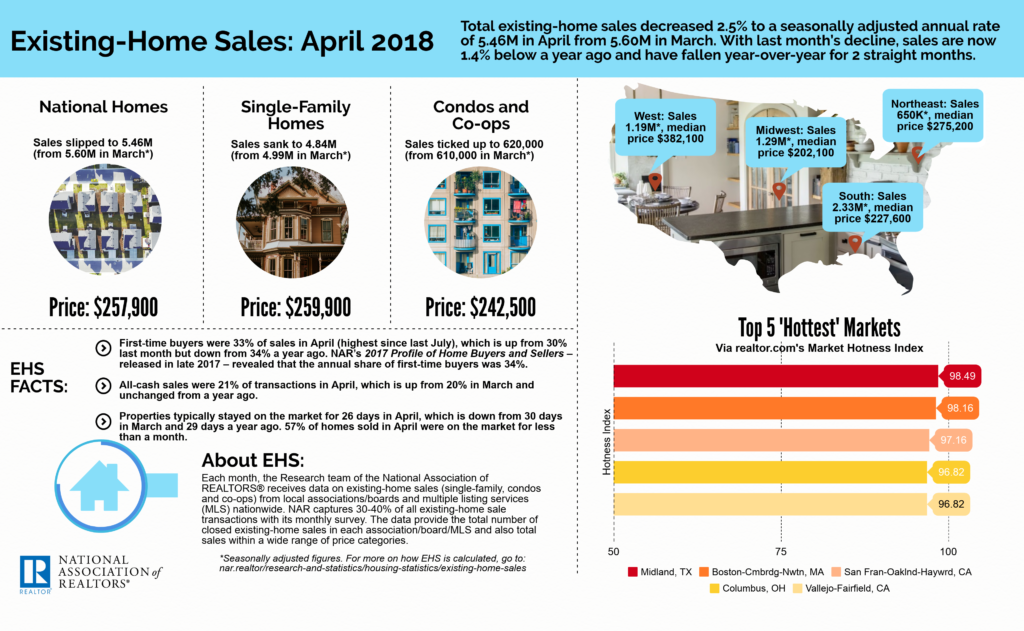
Distressed sales, which include foreclosures and short sales, were at 3.5 percent — down 1 percentage point from March and down 1.5 percentage points from a year ago. Three percent of April sales were foreclosures, and 0.5 percent were short sales.
Single-family home sales were at a SAAR of 4.84 million — a 3 percentage point month-over-month and a 1.6 percentage point year-over-year decrease. The sales price for single-family homes increased by 5.5 percentage points to $259,900.
Existing condominium and co-op sales increased 1.6 percentage points to a SAAR of 620,000 units, unchanged from a year ago. The median existing condo price in April was $242,500 — up 2.8 percentage points from 2017.
How did buying patterns vary across the country?Here’s the regional breakdown, straight from NAR:
April existing-home sales in the Northeast fell 4.4 percent to an annual rate of 650,000, and are 11 percent below a year ago. The median price in the Northeast was $275,200, which is 2.8 percent above April 2017. In the Midwest, existing-home sales were at an annual rate of 1.29 million in April (unchanged from March), and are 3 percent below a year ago. The median price in the Midwest was $202,100, up 4.6 percent from a year ago. Existing-home sales in the South decreased 2.9 percent to an annual rate of 2.33 million in April, but are still 2.2 percent above a year ago. The median price in the South was $227,600, up 3.9 percent from a year ago. Existing-home sales in the West declined 3.3 percent to an annual rate of 1.19 million in April, and are 0.8 percent below a year ago. The median price in the West was $382,100, up 6.2 percent from April 2017.NAR’s existing-home sales are based on transaction closings from MLSs and include single-family homes, townhomes, condominiums and co-ops. Seasonally adjusted annual rates are used in reporting monthly data to help accommodate for seasonal variation; the annual rate for any given month represents what the total number of actual sales for a year would be if the pace for that month were maintained for a whole year.
Source: click here


