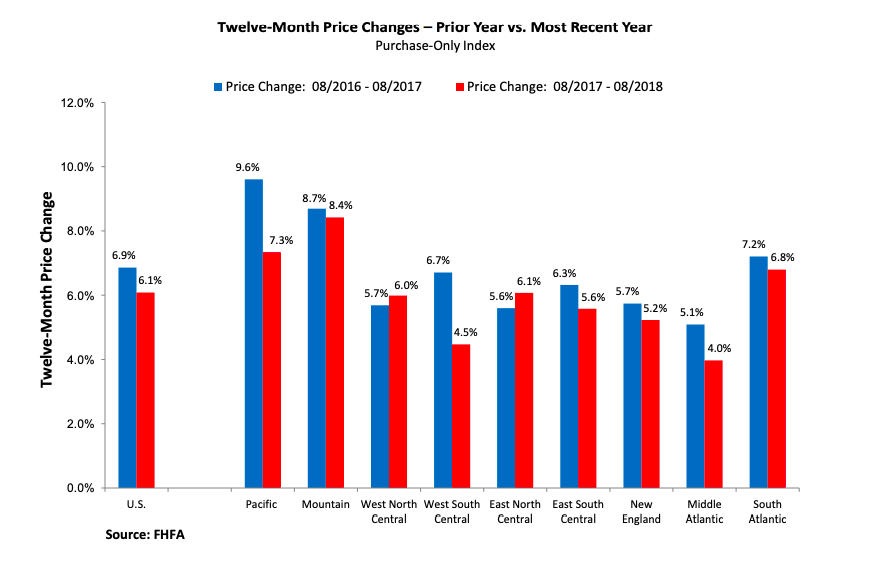
Seasonally adjusted home prices rose 0.3 percent month-over-month and 6.1 percent year-over-year in August, according to the Federal Housing Finance Agency’s latest House Price Index (HPI) report released on Wednesday. July’s HPI was revised upward from 0.2 percent to 0.4 percent month-over-month, noted the FHFA.
For the nine census divisions, the Middle Atlantic was the only one to experience a month-over-month decrease (-0.7%) in home prices. Meanwhile, the Pacific had the largest month-over-month increase at 0.8 percent followed by the East South Central and South Atlantic regions at 0.4 percent each.
On a year-over-year basis, all nine census divisions experienced an uptick in home prices with the Mountain division leading with an 8.4 percent gain, followed by the Middle Atlantic with a 4.0 percent increase.

The House Price Index is calculated using home sales price statistics from mortgages sold to or guaranteed by Fannie Mae and Freddie Mac and excludes high-priced properties bought with jumbo loans or cash sales.
Here are the states in each census division:
 Surprising rental market trends to watch in 2019
Read the new State of the Property Management Industry Report READ MORE
Pacific: Hawaii, Alaska, Washington, Oregon, California
Mountain: Montana, Idaho, Wyoming, Nevada, Utah, Colorado, Arizona, New Mexico
West North Central: North Dakota, South Dakota, Minnesota, Nebraska, Iowa, Kansas, Missouri
West South Central: Oklahoma, Arkansas, Texas, Louisiana
East North Central: Michigan, Wisconsin, Illinois, Indiana, Ohio
East South Central: Kentucky, Tennessee, Mississippi, Alabama
New England: Maine, New Hampshire, Vermont, Massachusetts, Rhode Island, Connecticut
Middle Atlantic: New York, New Jersey, Pennsylvania
South Atlantic: Delaware, Maryland, District of Columbia, Virginia, West Virginia, North Carolina, South Carolina, Georgia, Florida
Source: click here


