Please wait as we prepare your PDF file ....

Mission Chronicle Blog

Search Blog

our goal is to help you stay informed by providing timely and interesting articles.

Housing market heats up in all but biggest US cities: Case-Shiller

09/24/2019

Download PDF

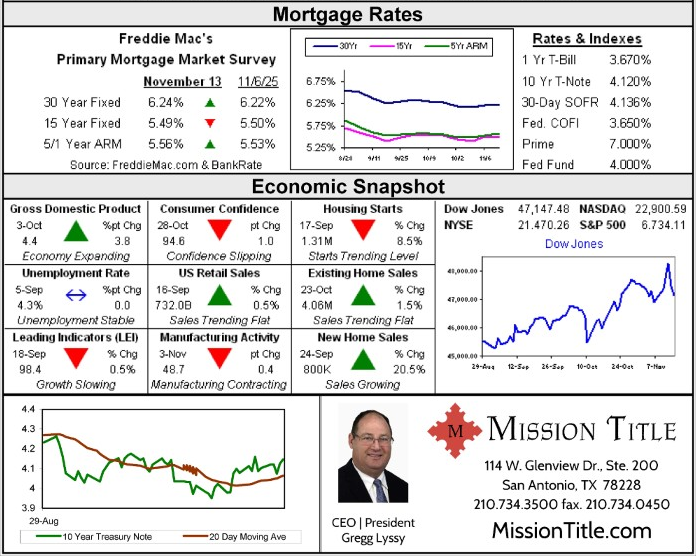
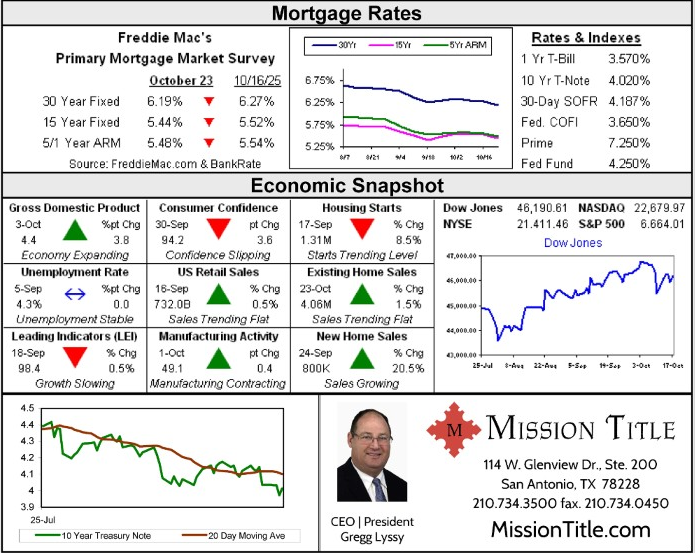
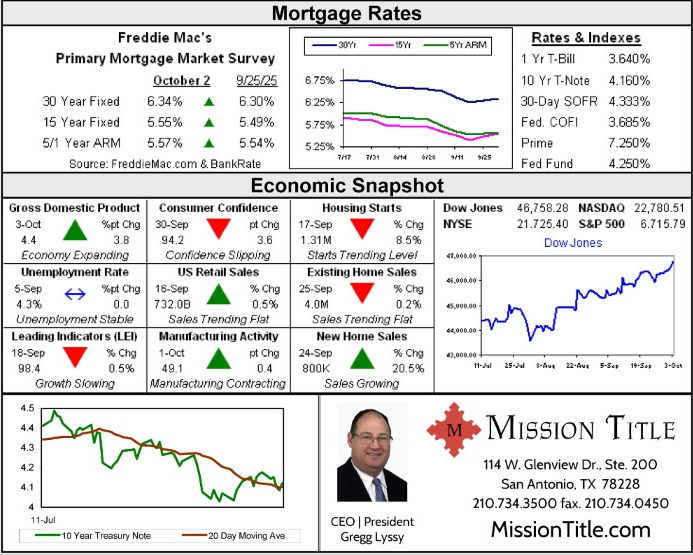
Following more than a year of diminishing growth, annual home price gains have finally begun to inch upward, according to the latest S&P CoreLogic Case-Shiller U.S. National Home Price NSA Index released Tuesday.

The index, which covers all nine U.S. census divisions, achieved an annual 3.2 percent gain in July, up from 3.1 percent in June.

The uptick reflects a heated housing market following sluggishness since March 2018. But the same cannot be said for America’s largest cities, according to CoreLogic data. Among the top 10 U.S. cities, the index rose only 1.6 percent, down from 1.9 percent in June.

“Home price gains remained positive in low single digits in most cities, and other fundamentals indicate renewed housing demand,” Philip Murphy, managing director and global head of index governance at S&P Dow Jones Indices, said in a press statement.

“According to the National Association of Realtors, the [year-over-year] change in existing home sales was positive in July for the first time in a number of months, and housing supply tightened since peaking in June,” he added.

The biggest gains occurred in Phoenix, Las Vegas and Charlotte, North Carolina, where home prices rose 5.8 percent, 4.7 percent and 4.6 percent, respectively.

6 things a technology ecosystem should do for real estate professionals It’s time the industry looked beyond platforms and focused on integrations READ MORE

Seattle, meanwhile, was the only city to see prices drop 0.6 percent although gains in San Francisco, Los Angeles and New York were also just above zero.

Released on the last Tuesday of each month, the index tracks the value of single-family housing within the United States by analyzing a composite of single-family home price indices for the nine U.S. Census divisions. The S&P CoreLogic Case-Shiller 10-City Composite Home Price Index is a value-weighted average of the 10 original metro area indices.

Email Veronika Bondarenko

Source: click here

Read More

INSPIRED, INTELLIGENT, INSIGHTFULL

STAY INFORMED WITH TIMELY AND INTERESTING ARTICLES FROM OUR BLOG, MISSION CHRONICLE. OUR ASPIRATION IS TO PROVIDE REALTORS AND OTHER REAL ESTATE INDUSTRY PROFESSIONALS WITH EXCEPTIONAL RESOURCES AND SHARE OUR KNOWLEDGE TO PROPEL YOU TO YOUR GOALS.

  • Mission Chronicle Newsletter Nov 3, 2025

    After last week's marginal employment data, the market is entirely pricing in a rate cut from the Fe...

  • Mission Chronicle Newsletter Oct 27, 2025

    After last week's marginal employment data, the market is entirely pricing in a rate cut from the Fe...

  • Mission Chronicle Newsletter Oct 20, 2025

    After last week's marginal employment data, the market is entirely pricing in a rate cut from the Fe...

  • Mission Chronicle Newsletter Oct 13, 2025

    After last week's marginal employment data, the market is entirely pricing in a rate cut from the Fe...

  • Mission Chronicle Newsletter Oct 6, 2025

    After last week's marginal employment data, the market is entirely pricing in a rate cut from the Fe...

  • Mission Chronicle Newsletter Sept 29, 2025

    After last week's marginal employment data, the market is entirely pricing in a rate cut from the Fe...

  • Mission Chronicle Newsletter Sept 22, 2025

    After last week's marginal employment data, the market is entirely pricing in a rate cut from the Fe...

  • Mission Chronicle Newsletter Sept 15, 2025

    After last week's marginal employment data, the market is entirely pricing in a rate cut from the Fe...

  • Mission Chronicle Newsletter Sept 8, 2025

    After last week's marginal employment data, the market is entirely pricing in a rate cut from the Fe...

  • Mission Chronicle Newsletter Sept 1, 2025

    Mortgage rates continued to press downward last week after the previous week's CPI data pointed to e...

November 2025
Mon Tue Wed Thu Fri Sat Sun
 12
3456789
10111213141516
17181920212223
24252627282930

  • Polls

    What information you are looking for?

    View Results

    Loading ... Loading ...
  • Last month Results

    How Is My Site?

    • Good (100%, 3 Votes)
    • Excellent (0%, 0 Votes)
    • Bad (0%, 0 Votes)
    • Can Be Improved (0%, 0 Votes)
    • No Comments (0%, 0 Votes)

    Total Voters: 3

    Vote

    Loading ... Loading ...