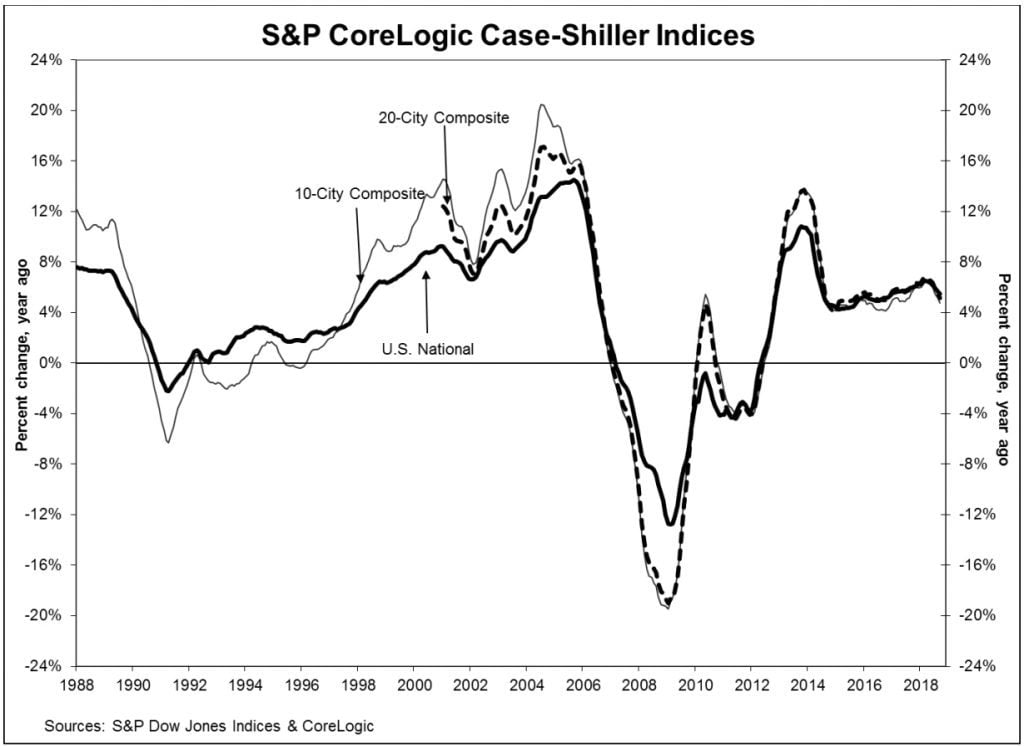
Home price gains slowed to 5.5 percent in September, year-over-year, according to the latest S&P CoreLogic Case-Shiller National Index. Year-over-year growth was down from 5.7 percent last month and the second time in 12 months price gains fell under 6 percent.
Credit: Case-Shiller
“Supply and demand are falling into balance in the housing market,” said Ralph McLaughlin, deputy chief economist and executive of research and insights for CoreLogic. “On the supply side, slow but steady growth in inventory is providing relief to homebuyers. On the demand side, years of price growth outpacing income growth, as well as rising mortgage rates, is making the cost of buying homes increasingly expensive.”
The western region led the way in gains, with Las Vegas up 13.5 percent year-over-year price, followed by San Francisco with a 9.9 percent increase and Seattle with an 8.4 percent increase. This is the second straight month where price gains in Seattle fell below 10 percent, after years of leading price growth among the cities tracked, according to Cheryl Young, senior economist at Trulia.
“The hot housing market of the past few years has been reduced to embers as home price growth continues to decelerate,” Young said, in a statement. “September marked the seventh month of flat or decelerating home price growth as the housing market settles into a slowdown.”
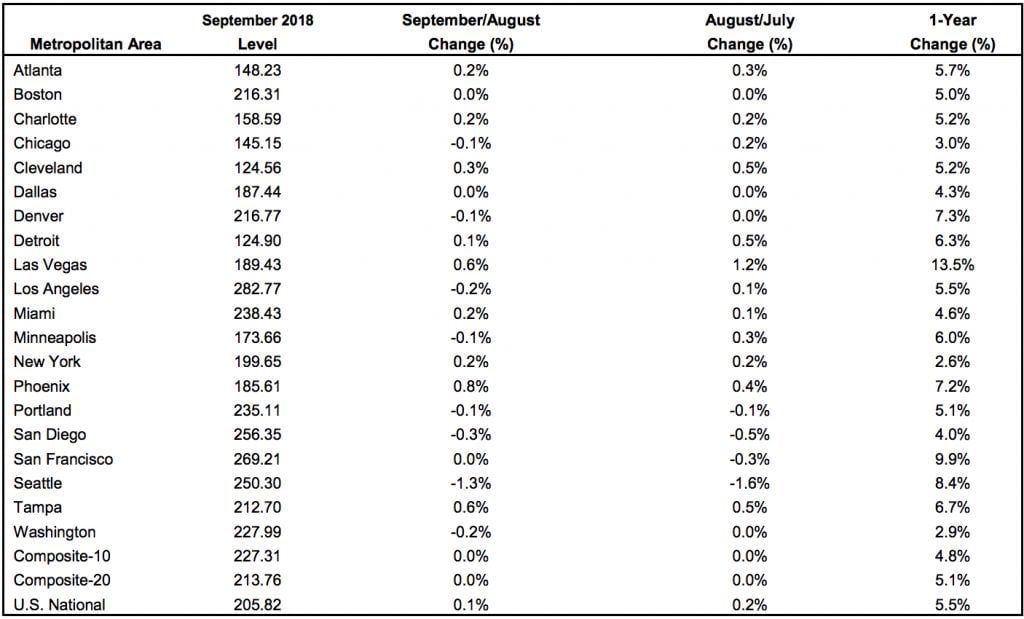
Credit: Case-Shiller
Despite prices still rising, more Americans are finding ways to become homeowners, according to Danielle Hale, the chief economist at realtor.com
 The questions you’re not asking your tech vendor
Protect your brokerage before you make a purchase READ MORE
“The homeownership rate has steadily climbed from an all-time low of 62.9 percent in the second quarter of 2016 to a rate of 64.4 percent in the third quarter of 2018,” Hale said. “Further increases in the homeownership rate will mean that future home price increases will mean wealth accumulation for a greater share of Americans.”
About the IndexThe S&P/Case-Shiller U.S. National Home Price Index is a composite of single-family home price indices that is calculated every month; the indices for the nine U.S. Census divisions are calculated using estimates of the aggregate value of single-family housing stock for the time period in question.
The nine divisions are:
New England Middle Atlantic East North Central West North Central South Atlantic East South Central West South Central Mountain PacificCoreLogic serves as the calculation agent for the S&P/Case-Shiller U.S. National Home Price Index.
Developing…
Source: click here


