Home prices in June are up for the 74th consecutive month, according to the latest S&P CoreLogic Case-Shiller National Home Price NSA Index, released Tuesday.
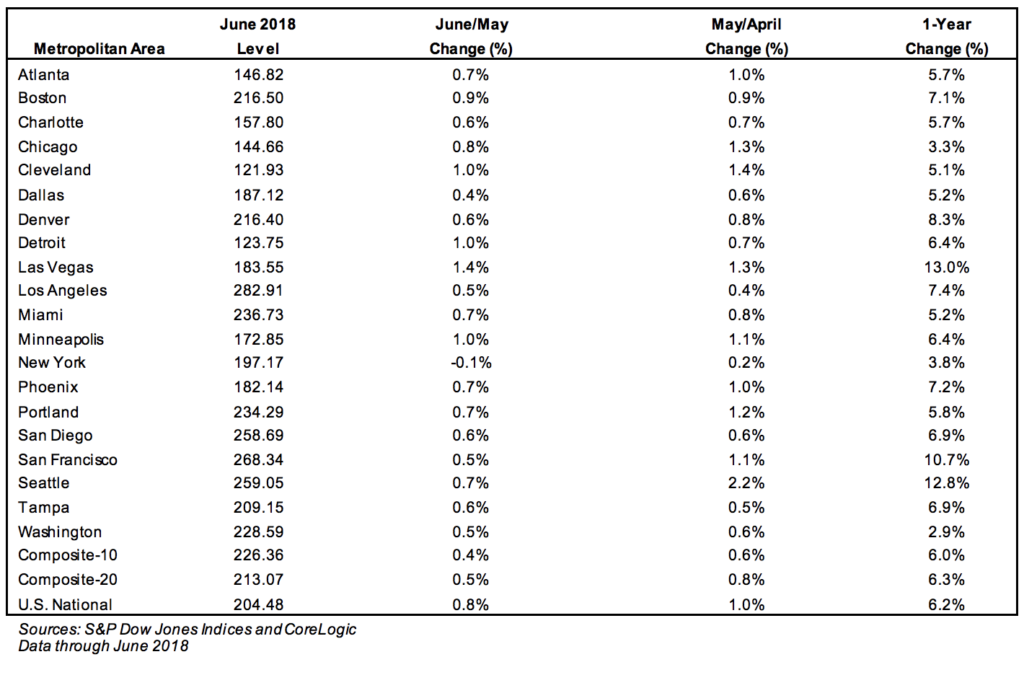
Home prices rose 6.2 percent from June 2017, in nine markets the index tracks, a slower pace than last month’s 6.4 percent year-over-year increase.
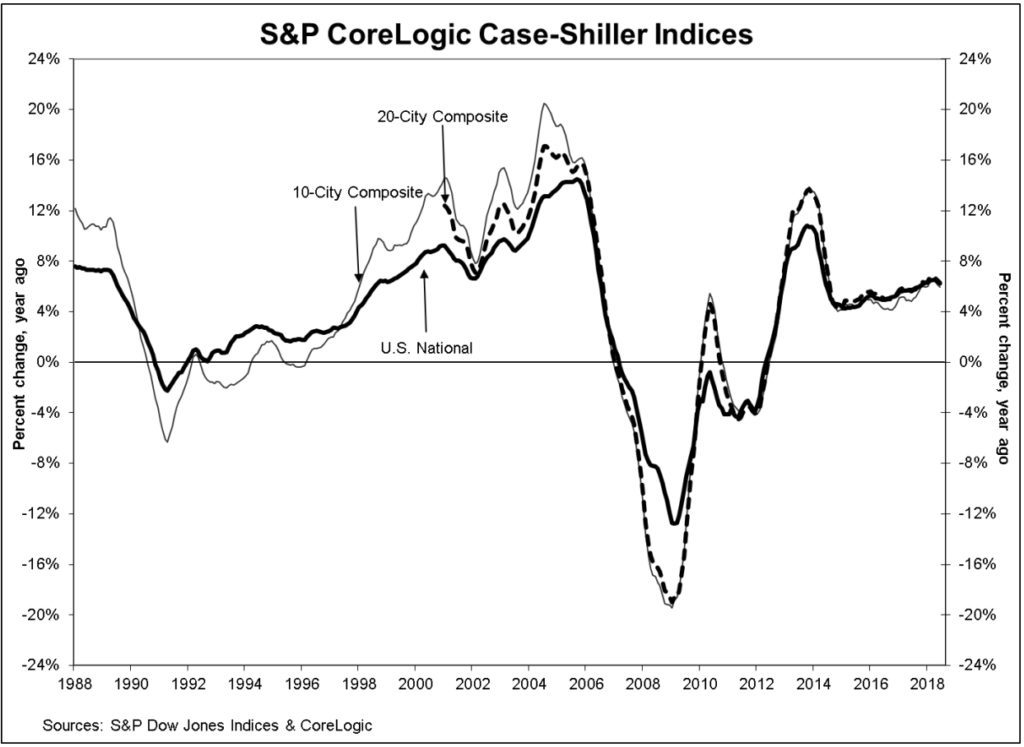 “Home prices continue to rise across the U.S.” said David Blitzer, managing director and chairman of the index committee at S&P Dow Jones Indices. “However, even as home prices keep climbing, we are seeing signs that growth is easing in the housing market.”
“Sales of both new and existing homes are roughly flat over the last six months amidst news stories of an increase in the number of homes for sale in some markets,” Blitzer added. “Rising mortgage rates – 30 year fixed rate mortgages rose from 4 percent to 4.5 percent since January – and the rise in home prices are affecting housing affordability.”
Regionally, Las Vegas, Seattle and San Francisco reported the highest year-over year gains among the 20 cities tracked by the index. Las Vegas saw a 13 percent gain, Seattle saw a 12.8 percent increase and San Francisco saw a 12.8 percent increase.
“The west still leads the rise in home prices with Las Vegas displacing Seattle as the market with the fastest price increase,” said Blitzer. “Population and employment growth often drive homes prices. Las Vegas is among the fastest growing U.S. cities based on both employment and population, with its unemployment rate dropping below the national average in the last year.”
 Closing techniques every sales expert should know
Tom Ferry shares two sure-fire ways to get a ‘yes’ READ MORE
“The northeast and mid-west are seeing smaller home price increases,” added Blitzer. “Washington, Chicago and New York City showed the three slowest annual price gains among the 20 cities covered.”
The S&P/Case-Shiller U.S. National Home Price Index is a composite of single-family home price indices that is calculated every month; the indices for the nine U.S. Census divisions are calculated using estimates of the aggregate value of single-family housing stock for the time period in question.
The nine divisions are:
New England Middle Atlantic East North Central West North Central South Atlantic East South Central West South Central Mountain PacificCoreLogic serves as the calculation agent for the S&P/Case-Shiller U.S. National Home Price Index.
Source: click here


