


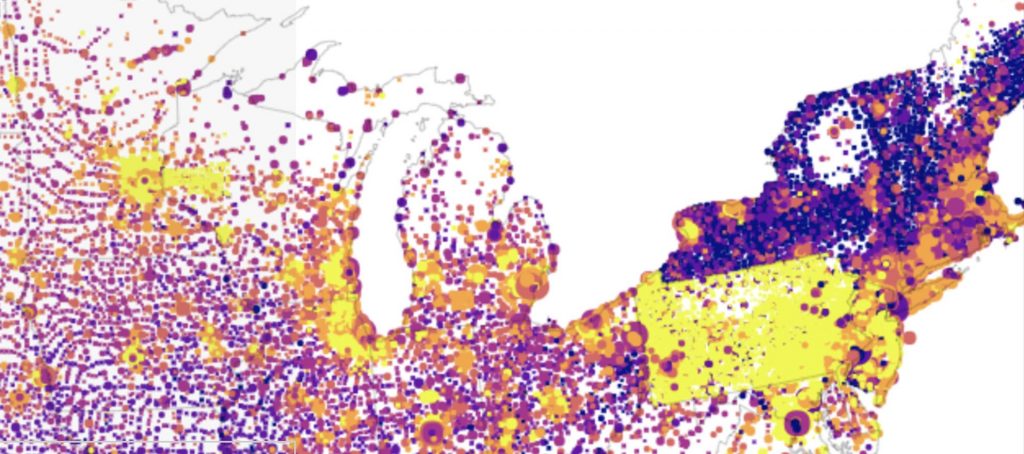
A Wikipedia editor and a history professor teamed up to visualize the population of U.S. cities and towns throughout history with more detail than the U.S. Census.
Creating Data is an online visualization that maps the locations of cities of over 50,000 people and lets you see how their populations have grown and fallen across the years since 1865. The overall picture is an awe-inspiring testament to America’s ever-migrating masses, as well as an endorsement of Wikipedia’s open crowdsourced model, and an indictment of the limitations of the census.
Benjamin Schmidt, an assistant professor of history at Northeastern University, created the database after stumbling upon Jacob Alperin-Sheriff’s work updating historical city populations on Wikipedia.
While searching the online encyclopedia for city records, Schmidt discovered that it often had more extensive population entries than the official census data he had been using. As it turned out, Alperin-Sheriff, now a cryptographer at the National Institute of Standards and Technology, spent the last five years updating Wikipedia entries with more than 25,000 city populations under the username DemocraticLuntz.
“I realized it was not just that people had been entering their own cities all around the country the way we sometimes think of Wikipedia working,” Schmidt, who used the dataset to create an interactive map, told Inman. “It was actually one guy who had entered in tens of thousands of historical population entries all around the United States.”
As a result, Schmidt asked Alperin-Sheriff for the data he collected and used it to create a visual map. To get the most extensive city records possible, Schmidt mined Wikipedia for city populations entered by other people, often historians working on their own city or town.
 5 tips to turn every listing presentation into a ‘yes'
Tom Ferry reinvents the listing presentation for maximum impact READ MORE
5 tips to turn every listing presentation into a ‘yes'
Tom Ferry reinvents the listing presentation for maximum impact READ MORE
Along with showing current populations, the interactive dataset tracks movement trends across time. For example, the map tracks people’s increasing migration to the suburbs throughout the 1950s and 1960s. Midwestern cities like Detroit, Cleveland and Chicago all saw up to 40 percent of their population move to the nearby suburban areas during that time.
The historic data also allowed Schmidt to observe that some very small towns in the US actually had booming populations at different points in time — for example, many New England towns too small to be included in census data had thousands of residents before people transitioned to the cities in the nineteenth century.
“That loss of population happened so long ago that the only evidence of it are stonewalls you see while walking through the forest,” Schmidt said.
The dataset, which can also be searched to find when a city or town gained most of its population, shows several trends throughout the U.S. While most major American cities grew between 1800 and 1950, suburbs and semi-rural areas saw most of their growth after 1945.
That said, the map and dataset have certain limitations — town populations are entered by many different people and do not always have data going back the same period of time.
Schmidt sees the dataset as an ongoing project. Along with expanding the map to include things like post offices and boat passageways, he hopes that the project will encourage others to add their own demographic research to the dataset for a visual showcase of just how extensively the US population changes over time.
“The distribution of the map shows that the history of America is a history of people continually uprooting and moving to new places,” said Schmidt.
Source: click here