


We’ll add more market news briefs throughout the day. Check back to read the latest.
Most recent market newsFriday, December 22

Click image for release
New home sales
Sales of new single-family houses in November 2017 were at a seasonally adjusted annual rate of 733,000. This is 17.5 percent (±10.4 percent) above the revised October rate of 624,000 and is 26.6 percent (±16.6 percent) above the November 2016 estimate of 579,000.Sales price
 BoomTown brings growth-minded teams into the digital age
Professional lead gen, a sleek website and a next-gen CRM in one platform READ MORE
BoomTown brings growth-minded teams into the digital age
Professional lead gen, a sleek website and a next-gen CRM in one platform READ MORE
The median sales price of new houses sold in November 2017 was $318,700. The average sales price was $377,100.
For sale inventory and months’ supply
The seasonally adjusted estimate of new houses for sale at the end of November was 283,000. This represents a supply of 4.6 months at the current sales rate. News from earlier this weekThursday, December 21
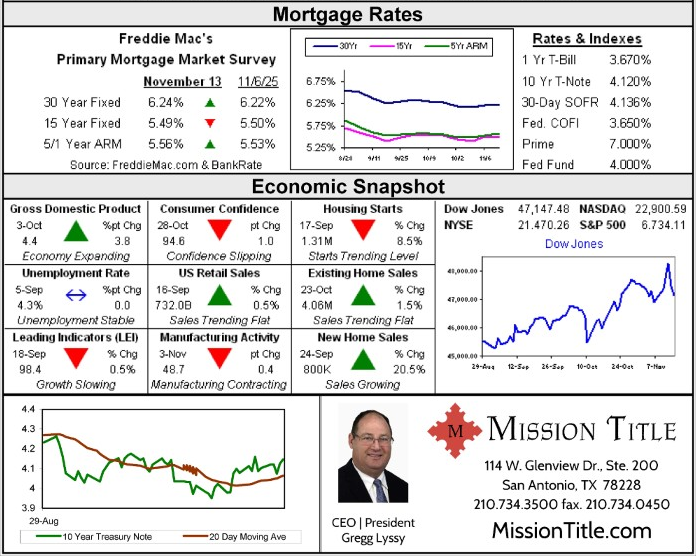
Freddie Mac Primary Mortgage Market Survey
30-year fixed-rate mortgage (FRM) averaged 3.94 percent with an average 0.5 point for the week ending December 21, 2017, up from last week when it averaged 3.93 percent. A year ago at this time, the 30-year FRM averaged 4.30 percent. 15-year FRM this week averaged 3.38 percent with an average 0.5 point, up from last week when it averaged 3.36 percent. A year ago at this time, the 15-year FRM averaged 3.52 percent. 5-year Treasury-indexed hybrid adjustable-rate mortgage (ARM) averaged 3.39 percent this week with an average 0.3 point, up from last week when it averaged 3.36 percent. A year ago at this time, the 5-year ARM averaged 3.32 percent.
Said Len Kiefer, Deputy Chief Economist: “30-year fixed mortgage rates have been bouncing around in a narrow 10 basis points range since October. The U.S. average 30-year fixed mortgage rate increased 1 basis point to 3.94 percent in this week’s survey.
“The majority of our survey was completed prior to the surge in long-term interest rates that followed the passage of the tax bill. If those rate increases stick, we’ll likely see higher mortgage rates in next week’s survey.
“But even with yesterday’s increase, the 10-year Treasury yield is down from a year ago, and 30-year fixed mortgage rates are 36 basis points below the level we saw in our survey last year at this time. Mortgage rates are low.”
The 30-year fixed mortgage rate on Zillow Mortgages is currently 3.80 percent, up six basis points from this time last week. The 30-year fixed mortgage rate hovered around 3.70 percent for most of the week before rising to the current rate on Tuesday. The rate for a 15-year fixed home loan is currently 3.21 percent, and the rate for a 5-1 adjustable-rate mortgage (ARM) is 3.31 percent. The rate for a jumbo 30-year fixed loan is 3.93 percent.
Current rates for 30-year fixed mortgages by state. Source: Zillow
“After holding steady in a narrow range for much of last week — even after the Federal Reserve increased its benchmark short-term interest rate — mortgage rates increased sharply on Tuesday to their highest level since late October,” said Aaron Terrazas, senior economist at Zillow.
“While the increase coincided with the passage of tax reform legislation in Congress, the effects of the reform were already largely priced into markets. Beyond inflation and output data due later this week, markets should be relatively quiet moving into the Christmas holiday.
“Low trading volumes this time of year could exaggerate smaller movements that would not have as much of an impact during normal trading times.”
Zillow’s real-time mortgage rates are based on thousands of custom mortgage quotes submitted daily to anonymous borrowers on the Zillow Mortgages site and reflect the most recent changes in the market. These are not marketing rates, or a weekly survey.
90-day delinquent mortgage inventory spiked 13 percent in November, the largest monthly increase since 2008 as the financial crisis began to unfold While 90-day delinquency increases are common in November, the volumes seen this year are noteworthy Over 85 percent — approximately 66,000 — of the month’s 77,000 new severely delinquent loans can be attributed to hurricanes Harvey and Katrina As a result, the current estimate of 90-day delinquencies resulting from Harvey and Irma totals over 85,000 Inflow of new hurricane-driven delinquencies has slowed, with Irma-related delinquencies up 8,200 month-over-month, while Harvey-related delinquencies declined by 8,400 The 2.5 percent increase in the overall national delinquency rate is attributable to typical seasonality; November increases have been observed in nine of the past 10 years and 16 of the past 18
About Black Knight, Inc.
Black Knight (NYSE:BKI) is a leading provider of integrated software, data and analytics solutions that facilitate and automate many of the business processes across the homeownership lifecycle. ?
Black Knight is committed to being a premier business partner that clients rely on to achieve their strategic goals, realize greater success and better serve their customers by delivering best-in-class software, services and insights with a relentless commitment to excellence, innovation, integrity and leadership.
Wednesday, December 20
Mortgage Bankers Association’s (MBA) Weekly Mortgage Applications Survey
The Market Composite Index, a measure of mortgage loan application volume, decreased 4.9 percent on a seasonally adjusted basis from one week earlier. On an unadjusted basis, the Index decreased 6 percent compared with the previous week. The Refinance Index decreased 3 percent from the previous week. The seasonally adjusted Purchase Index decreased 6 percent from one week earlier. The unadjusted Purchase Index decreased 9 percent compared with the previous week and was 1 percent higher than the same week one year ago. The refinance share of mortgage activity increased to 53.9 percent of total applications, its highest level since December 2016, from 52.4 percent the previous week. The adjustable-rate mortgage (ARM) share of activity remained unchanged at 5.6 percent of total applications. The FHA share of total applications decreased to 11.3 percent from 11.8 percent the week prior. The VA share of total applications increased to 10.9 percent from 10.3 percent the week prior. The USDA share of total applications remained unchanged at 0.7 percent from the week prior. The average contract interest rate for 30-year fixed-rate mortgages with conforming loan balances ($424,100 or less) decreased to 4.16 percent from 4.20 percent, with points decreasing to 0.35 from 0.39 (including the origination fee) for 80 percent loan-to-value ratio (LTV) loans. The average contract interest rate for 30-year fixed-rate mortgages with jumbo loan balances (greater than $424,100) increased to 4.14 percent from 4.11 percent, with points increasing to 0.30 from 0.28 (including the origination fee) for 80 percent LTV loans. The average contract interest rate for 30-year fixed-rate mortgages backed by the FHA decreased to 4.11 percent from 4.13 percent, with points increasing to 0.41 from 0.39 (including the origination fee) for 80 percent LTV loans. The average contract interest rate for 15-year fixed-rate mortgages decreased to 3.60 percent from 3.61 percent, with points decreasing to 0.39 from 0.44 (including the origination fee) for 80 percent LTV loans. The average contract interest rate for 5/1 ARMs increased to 3.49 percent from 3.42 percent, with points increasing to 0.52 from 0.48 (including the origination fee) for 80 percent LTV loans.Tuesday, December 19
CoreLogic Housing Credit Insights Q3 2017 Update
Housing Credit Nationally
In Q3 2017, the HCI increased to 111.1, up 18 points from Q3 2016. Even with this increase, the level of credit risk in Q2 2017 is still within a range of the HCI for the period of 2001 to 2003, a timeframe that is considered to be a normal baseline for credit risk. The loosening in the credit index during the past quarter was partly due to a shift in the mix of more investor and condominium loans which offset lower-risk signals from the credit score, DTI and LTV attributes. Credit Score
Debt-to-Income (DTI)
Holding steady at 36 percent, the average DTI for homebuyers in Q3 2017 was similar to Q2 2016. In Q2 2017, the share of homebuyers with DTIs greater than or equal to 43 percent was 22 percent, down slightly from 24 percent in Q3 2016, but up from 18 percent in 2001.Loan-to-Value (LTV)
The LTV for homebuyers dropped by almost 2 percentage points between Q2 2016 and Q3 2017, down from 86.4 percent to 84.9 percent. In Q3 2017, the share of homebuyers with an LTV greater than or equal to 95 percent had increased by almost one-half compared with 2001.
Investor ShareInvestor Share
The investor share of home-purchase loans increased from 4 percent in Q3 2016 to 4.4 percent in Q3 2017.Condo/Co-Op Share
The share of home-purchase loans secured by a condominium or a co-op building increased from 10 percent in Q3 2016 to 11.5 percent in Q3 2017.Documentation Type
Low- or no-documentation loans remained a small part of the mortgage market, slightly increasing from 1.5 percent to 2.2 percent of home-purchase loans during the past year.
“The CoreLogic Housing Credit Index is up compared to year a ago, in part reflecting a shift in the mix of loans to the purchase market, which typically exhibit higher risk,” said Frank Nothaft, chief economist at CoreLogic.
“Further the Index shows higher risk attributes for both purchase and refinance loans, although the risk levels still remain similar to the early 2000s. When looking at the two most recent quarters in which the mix of purchase and refinance loans were similar, the CoreLogic Housing Credit Index for each segment remained stable.
“Looking forward to 2018, with continuing economic and home price growth, we expect credit-risk metrics to rise modestly.”
Tuesday, December 19
CoreLogic Loan Performance Insights
30 days or more delinquent – national
The 30 days or more delinquency rate for September 2016 was 5.2 percent. In September 2017, 5 percent of mortgages were delinquent by at least 30 days or more including those in foreclosure. This represents a 0.2 percentage point decline in the overall delinquency rate compared with September 2016.Loan performance – national
As of September 2017, the foreclosure inventory rate was 0.6 percent down from 0.8 percent in September 2016.Transition rates – national
The share of mortgages that transitioned from current to 30-days past due was 1.3 percent in September 2017, up from 0.9 percent in September 2016. By comparison, in January 2007, just before the start of the financial crisis, the current-to-30-day transition rate was 1.2 percent and peaked in November 2008 at 2 percent.

“September’s early-stage delinquency rate increased by 0.3 percent from a year ago, the largest increase since June 2009,” said Frank Nothaft, chief economist at CoreLogic.
“This does not reflect a deterioration in credit, but rather the impact of the hurricanes in Texas, Florida and Puerto Rico. September’s early-stage delinquency transition rate rose to 2.6 percent in Texas and it rose to 3.2 percent in Florida, which is higher than the 1 percent that’s typical for both states.
“Texas and Florida’s early-state delinquency transition rates in September are much lower than New Orleans in September 2005 when the transition rate reached 17.4 percent as a result of Hurricane Katrina.”

Click to view original source
Building permits
Privately-owned housing units authorized by building permits in November were at a seasonally adjusted annual rate of 1,298,000. This is 1.4 percent (±1.7 percent) below the revised October rate of 1,316,000, but is 3.4 percent (±2.3 percent) above the November 2016 rate of 1,255,000. Single-family authorizations in November were at a rate of 862,000; this is 1.4 percent (±1.6 percent) above the revised October figure of 850,000. Authorizations of units in buildings with five units or more were at a rate of 395,000 in November.Housing starts
Privately-owned housing starts in November were at a seasonally adjusted annual rate of 1,297,000. This is 3.3 percent (±9.1 percent) above the revised October estimate of 1,256,000 and is 12.9 percent (±11.7 percent) above the November 2016 rate of 1,149,000. Single-family housing starts in November were at a rate of 930,000; this is 5.3 percent (±10.2 percent) above the revised October figure of 883,000. The November rate for units in buildings with five units or more was 359,000.Housing completions
Privately-owned housing completions in November were at a seasonally adjusted annual rate of 1,116,000. This is 6.1 percent (±10.4 percent) below the revised October estimate of 1,189,000 and is 7.2 percent (±12.5 percent) below the November 2016 rate of 1,203,000. Single-family housing completions in November were at a rate of 752,000; this is 4.6 percent (±12.0 percent) below the revised October rate of 788,000. The November rate for units in buildings with five units or more was 353,000.Email market reports to press@inman.com.
Source: click here