


We’ll add more market news briefs throughout the day. Check back to read the latest.
Most recent market newsThursday, November 30
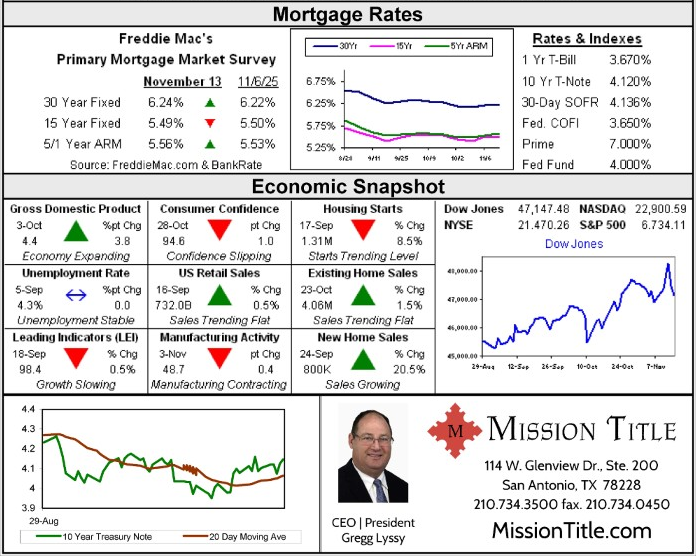
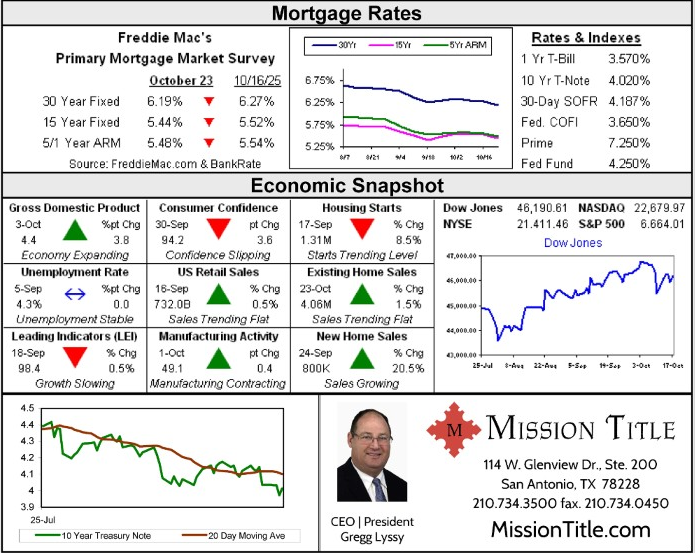
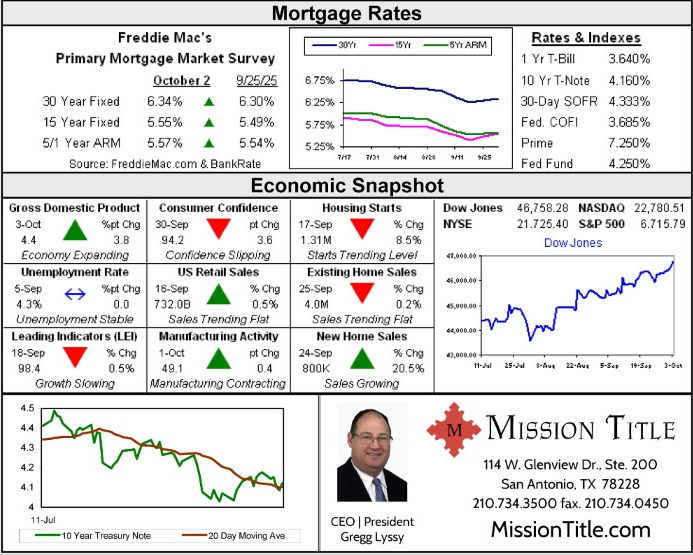
Freddie Mac Primary Mortgage Market Survey
30-year fixed-rate mortgage (FRM) averaged 3.90 percent with an average 0.5 point for the week ending November 30, 2017, down from last week when it averaged 3.92 percent. A year ago at this time, the 30-year FRM averaged 4.08 percent. 15-year FRM this week averaged 3.30 percent with an average 0.5 point, down from last week when it averaged 3.32 percent. A year ago at this time, the 15-year FRM averaged 3.34 percent. 5-year Treasury-indexed hybrid adjustable-rate mortgage (ARM) averaged 3.32 percent this week with an average 0.3 point, up from last week when it averaged 3.22 percent. A year ago at this time, the 5-year ARM averaged 3.15 percent.
U.S. weekly averages as of 11/22/2017: Freddie Mac

“The 30-year fixed mortgage rate fell two basis points to 3.9 percent in this week’s survey, but we closed our survey prior to a surge in long-term interest rates following an upward revision to third quarter U.S. Real GDP growth and comments by Federal Reserve Chair Yellen touting a broad-based economic expansion,” said Len Kiefer, Deputy Chief Economist at Freddie Mac.
 Gain a massive competitive advantage with a modern RE CRM
3 reasons you need to replace your dumb CRM with a smart one READ MORE
Gain a massive competitive advantage with a modern RE CRM
3 reasons you need to replace your dumb CRM with a smart one READ MORE
“The market implied probability of a Fed rate hike in December neared 100 percent, helping to drive short term interest rates higher. The 5/1 Hybrid ARM, which is more sensitive to short-term rates than the 30-year fixed mortgage, increased 10 basis points to 3.32 percent in this week’s survey.
“The spread between the 30-year fixed mortgage and 5/1 Hybrid ARM is just 58 basis points this week, the lowest spread since November of 2012.”
The 30-year fixed mortgage rate on Zillow Mortgages is currently 3.73 percent, up one basis point from this time last week. The rate for a 15-year fixed home loan is currently 3.11 percent, and the rate for a 5-1 adjustable-rate mortgage (ARM) is 3.21 percent.
Zillow’s current rates for 30-year fixed mortgages by state.
“Mortgage rates were flat last week, holding near levels observed for much of the past six months, as lenders and consumers focused primarily on the Thanksgiving holiday,” said Aaron Terrazas, senior economist at Zillow.
“Despite several major economic events — including confirmation hearings for the next Chair of the Federal Reserve and major developments on tax reform -– rates are unlikely to move dramatically as markets await the Fed’s next interest rate move in mid-December.”
News from earlier this weekWednesday, November 29
Federal Housing Finance Agency (FHFA) Index shows mortgage rates decreased in October
Nationally, interest rates on conventional purchase-money mortgages decreased from September to October. The National Average Contract Mortgage Rate for the Purchase of Previously Occupied Homes by Combined Lenders Index was 3.98 percent for loans closed in late October, down 2 basis points from 4.00 percent in September. The average interest rate on all mortgage loans was 3.97 percent, down 2 basis points from 3.99 in September. The average interest rate on conventional, 30-year, fixed-rate mortgages of $424,100 or less was 4.11 percent, down 3 basis points from 4.14 in September. The effective interest rate on all mortgage loans was 4.01 percent in October, down 7 basis points from 4.08 in September. The effective interest rate accounts for the addition of initial fees and charges over the life of the mortgage. The average loan amount for all loans was $307,500 in October, up $8,000 from $299,500 in September.
National Average Contract Mortgage Rate Previously Occupied Homes October 2016 – October 2017
National Association of Realtors Pending Home Sales Index
The Pending Home Sales Index rose 3.5 percent to 109.3 in October from a downwardly revised 105.6 in September. The index is now at its highest reading since June (110.0), but is still 0.6 percent below a year ago. The PHSI in the Northeast inched forward 0.5 percent to 95.0 in October, but is still 1.9 percent below a year ago. In the Midwest the index increased 2.8 percent to 105.8 in October, but remains 0.9 percent lower than October 2016. Pending home sales in the South jumped 7.4 percent to an index of 123.6 in October and are now 2.0 percent higher than last October. The index in the West decreased 0.7 percent in October to 101.6, and is now 4.4 percent below a year ago.
Click image for NAR release
“Last month’s solid increase in contract signings were still not enough to keep activity from declining on an annual basis for the sixth time in seven months,” said Lawrence Yun, NAR chief economist.
“Home shoppers had better luck finding a home to buy in October, but slim pickings and consistently fast price gains continue to frustrate and prevent too many would-be buyers from reaching the market,” Yun added.
Mortgage Bankers Association’s (MBA) Weekly Mortgage Applications Survey
The Market Composite Index, a measure of mortgage loan application volume, decreased 3.1 percent on a seasonally adjusted basis from one week earlier. On an unadjusted basis, the Index decreased 34 percent compared with the previous week. The Refinance Index decreased 8 percent from the previous week to its lowest level since January 2017. The seasonally adjusted Purchase Index increased 2 percent from one week earlier to its highest level since September 2017. The unadjusted Purchase Index decreased 32 percent compared with the previous week and was 6 percent higher than the same week one year ago. The refinance share of mortgage activity decreased to 48.7 percent of total applications from 49.9 percent the previous week. The adjustable-rate mortgage (ARM) share of activity decreased to 6.2 percent of total applications. The FHA share of total applications increased to 10.8 percent from 10.6 percent the week prior. The VA share of total applications increased to 11.0 percent from 10.7 percent the week prior. The USDA share of total applications increased to 0.8 percent from 0.7 percent the week prior. The average contract interest rate for 30-year fixed-rate mortgages with conforming loan balances ($424,100 or less) remained unchanged from the week prior at 4.20 percent, with points decreasing to 0.34 from 0.42 (including the origination fee) for 80 percent loan-to-value ratio (LTV) loans. The effective rate decreased from last week. The average contract interest rate for 30-year fixed-rate mortgages with jumbo loan balances (greater than $424,100) decreased to 4.14 percent from 4.16 percent, with points decreasing to 0.27 from 0.30 (including the origination fee) for 80 percent LTV loans. The average contract interest rate for 30-year fixed-rate mortgages backed by the FHA decreased to 4.07 percent from 4.08 percent, with points decreasing to 0.37 from 0.42 (including the origination fee) for 80 percent LTV loans. The average contract interest rate for 15-year fixed-rate mortgages increased to 3.57 percent from 3.56 percent, with points decreasing to 0.40 from 0.42 (including the origination fee) for 80 percent LTV loans. The average contract interest rate for 5/1 ARMs increased to 3.42 percent from 3.31 percent, with points increasing to 0.58 from 0.38 (including the origination fee) for 80 percent LTV loans.Tuesday, November 28
S&P CoreLogic Case-Shiller Home Price Indices (HPI)
There was a 6.2 percent annual gain in September, up from 5.9 percent in the previous month. The 10-City Composite annual increase came in at 5.7 percent, up from 5.2 percent the previous month. The 20-City Composite posted a 6.2 percent year-over-year gain, up from 5.8 percent the previous month. Seattle, Las Vegas, and San Diego reported the highest year-over-year gains among the 20 cities. In September, Seattle led the way with a 12.9 percent year-over-year price increase, followed by Las Vegas with a 9.0 percent increase, and San Diego with an 8.2 percent increase. 13 cities reported greater price increases in the year ending September 2017 versus the year ending August 2017.

Click image for original report
Before seasonal adjustment, the National Index posted a month-over-month gain of 0.4 percent in September. The 10-City and 20-City Composites reported increases of 0.5 percent and 0.4 percent, respectively. After seasonal adjustment, the National Index recorded a 0.7 percent month-over-month increase in September. The 10-City and 20-City Composites posted 0.6 percent and 0.5 percent month-over-month increases, respectively. 15 of 20 cities reported increases in September before seasonal adjustment, while all 20 cities reported increases after seasonal adjustment.“Most economic indicators suggest that home prices can see further gains,” said Managing Director and Chairman of the Index Committee at S&P Dow Jones Indices David M. Blitzer.
“Rental rates and home prices are climbing, the rent-to-buy ratio remains stable, the average rate on a 30-year mortgage is still under 4 percent, and at a 3.8-month supply, the inventory of homes for sale is still low.
“The overall economy is growing with the unemployment rate at 4.1 percent, inflation at 2 percent and wages rising at 3 percent or more. One dark cloud for housing is affordability — rising prices mean that some people will be squeezed out of the market,” Blitzer added.
Federal Housing Finance Agency (FHFA) House Price Index (HPI) Q3 2017 Report
U.S. house prices rose 1.4 percent in the third quarter of 2017. House prices rose 6.5 percent from the third quarter of 2016 to the third quarter of 2017. FHFA’s seasonally adjusted monthly index for September was up 0.3 percent from August. Home prices rose in 50 states and the District of Columbia between the third quarter of 2016 and the third quarter of 2017. The top five areas in annual appreciation were: 1) District of Columbia 11.6 percent; 2) Washington 11.5 percent; 3) Hawaii 10.0 percent; 4) Arizona 10.0 percent; and 5) Nevada 9.6 percent. Home prices rose in each of the 100 largest metropolitan areas in the U.S. over the last four quarters. Annual price increases were greatest in the Seattle-Bellevue-Everett, WA (MSAD), where prices increased by 14.6 percent. Prices were weakest in Camden, NJ (MSAD), where they rose 0.5 percent. Of the nine census divisions, the Pacific division experienced the strongest annual appreciation, posting an 8.9 percent gain since the third quarter of last year and a 1.7 percent increase since the second quarter of 2017. House price appreciation was weakest in the Middle Atlantic division, where prices rose 4.8 percent annually.FHFA’s video of highlights for Q3 2017
Monday, November 27

Click image for original PDF report.
Sales of new single-family houses in October 2017 were at a seasonally adjusted annual rate of 685,000. This is 6.2 percent (±19.0 percent) above the revised September rate of 645,000, and is 18.7 percent (±23.5 percent) above the October 2016 estimate of 577,000. The median sales price of new houses sold in October 2017 was $312,800. The average sales price was $400,200. The seasonally adjusted estimate of new houses for sale at the end of October was 312,800. This represents a supply of 4.9 months at the current sales rate.Email market reports to press@inman.com.
Source: click here