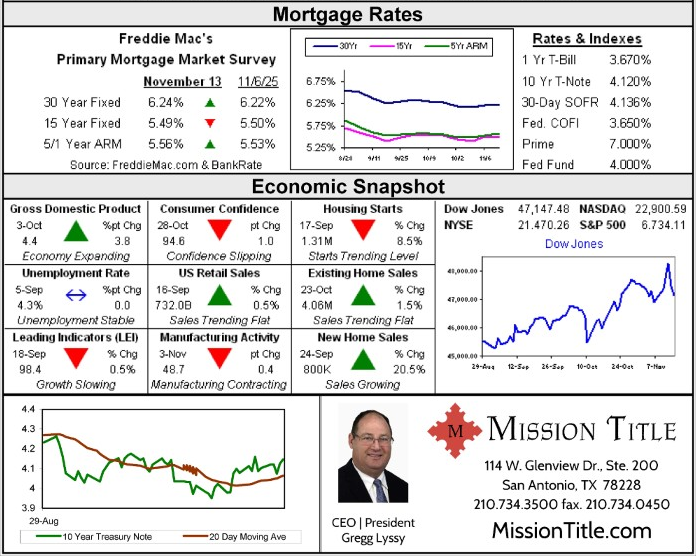
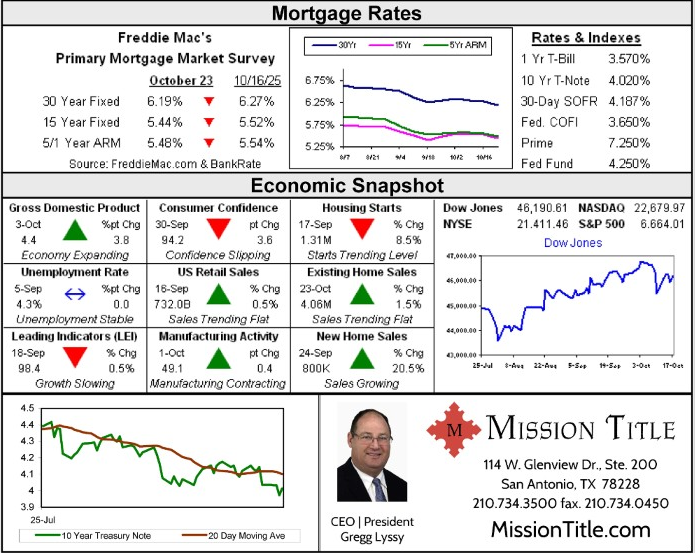
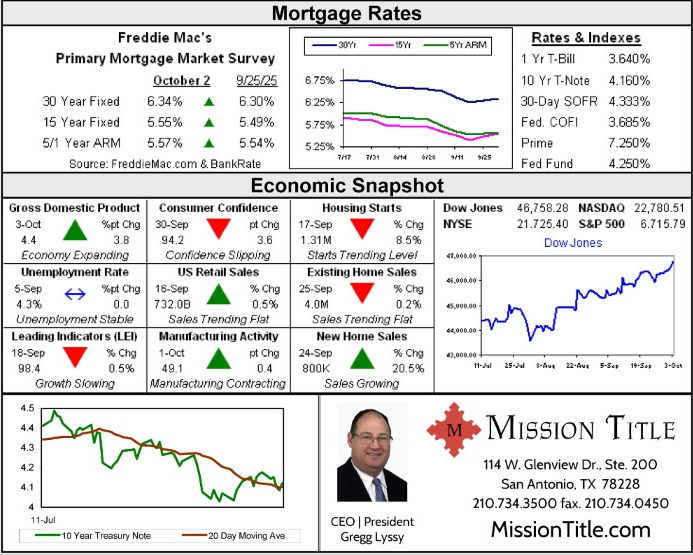
Check Inman every day for the daily version of this market roundup.
Mortgage rates: 30-Year Fixed Rate Mortgage Rates for the Past 6 Months | Credio 15-Year Fixed Rate Mortgage Rates for the Past 6 Months | Credio Home equity rates:Credio | Graphiq Day-by-day market activity
Thursday, February 2:
Freddie Mac’s Primary Mortgage Market Survey:
The 30-year fixed-rate mortgage (FRM) averaged 4.19 percent with an average 0.5 point for the week ending Feb. 2, 2017. The rate is unchanged from last week. A year ago at this time, the 30-year FRM averaged 3.72 percent.Attom Data Solutions Year-End 2016 Home Sales Report:
16.2 percent of single family home and condo sales in 2016 were distressed sales, which is down from 18.8 percent of all sales in 2015 to the lowest level since 2007, a nine-year low. Among 193 metropolitan statistical areas with a population of 200,000 or more and at least 100 distressed sales in 2016, those with the highest share of total distressed sales were Atlantic City, New Jersey (43.8 percent); Hagerstown-Martinsburg, Maryland-West Virginia (33.2 percent); Rockford, Illinois (29.2 percent); Montgomery, Alabama (29.2 percent); and Baltimore, Maryland (28.0 percent). Bank-owned (REO) sales accounted for 8.0 percent of all sales in 2016, down from 10.0 percent in 2015 to the lowest level since 2006 — a 10-year low.Wednesday, February 1:
Mortgage Bankers Association’s Weekly Applications Survey:
Mortgage applications decreased 3.2 percent from one week earlier for the week ending January 27, 2017. The refinance share of mortgage activity decreased to 49.4 percent of total applications from 50.0 percent the previous week. The average contract interest rate for 30-year fixed-rate mortgages with conforming loan balances increased to 4.39 percent from 4.35 percent.U.S. Census Bureau December 2016 Construction Report:
Construction spending during December 2016 was estimated at a seasonally adjusted annual rate of $1.1815 trillion. This is 0.2 percent below the revised November estimate of $1.1844 trillion. The December figure is 4.2 percent above the December 2015 estimate of $1.1337 trillion.Apartment List National Rent Report for February 2016:
Nationwide, rents increased rapidly throughout 2014 and 2015 but have plateaued since May 2016. Rents have fallen in San Francisco, San Jose, Miami and Houston. Rents continue to climb in some secondary cities — Tacoma, Washington; Arlington, Texas; Long Beach, CaliforniaTuesday, January 31
U.S. Department of Housing and Urban Development’s National Housing Market Summary for Q3 2016:
Construction starts on single-family homes, at 759,000 units (seasonally adjusted annual rate — SAAR) in the third quarter of 2016, were up slightly from the previous quarter (1 percent) and previous year (2 percent). The pace of single-family housing starts is now more than half the annual rate of 1.36 million units in 2002, before the housing bubble began. Multifamily housing starts fell to 373,000 units (SAAR) in the third quarter, a decrease of 5 percent from the previous quarter and 7 percent from the previous year.U.S. Census Bureau’s Quarterly Residential Vacancies and Homeownership, Q4 2016:
National vacancy rates in the fourth quarter 2016 were 6.9 percent for rental housing and 1.8 percent for homeowner housing. The rental vacancy rate of 6.9 percent was not statistically different from the rate in the fourth quarter 2015 (7.0 percent) or the rate in the third quarter 2016 (6.8 percent). The homeowner vacancy rate of 1.8 percent was not statistically different from the rate in the fourth quarter 2015 (1.9 percent) or the rate in the third quarter 2016 (1.8 percent). The homeownership rate of 63.7 percent was not statistically different from the rate in the fourth quarter 2015 (63.8 percent) or the rate in the third quarter 2016 (63.5 percent).
U.S. Census Bureau Q4 2016 rental and homeownership data
Ten-X Residential Real Estate Nowcast for January 2017:
January sales will fall between seasonally adjusted annual rates of 5.32 and 5.67 million, with a targeted number of 5.49 million. This is the same number of homes sold in December of 2016. It’s also an increase of 0.03 million from January 2016.Attom Data Solutions ‘Best Month To Buy A Home’ Report:
Buyers get, on average, a 6.1 percent discount in February. January, March and April are the next-best months in which to buy.Monday, January 30
Black Knight Financial Services Home Price Index for November 2016:
After rising 5.7 percent from the start of 2016, U.S. home prices are now within just 0.3 percent of a new national peak. For the fifth straight month, New York led all states in monthly home price appreciation, seeing 1.1 percent growth from October 2016. Home prices hit new peaks in six of the nation’s 20 largest states and eight of the 40 largest metros.First American Real House Price Index for November 2016:
Real house prices increased 4.4 percent between October 2016 and November 2016 Compared to November 2015, real house prices increased by 1.7 percent. Real house prices are 37.1 percent below their housing-boom peak in July 2006 and 15.5 percent below the level of prices in January 2000.National Association of Realtors Pending Home Sales for December 2016:
The Pending Home Sales Index (PHSI) increased 1.6 percent to 109.0 in December from 107.3 in November. The index is now 0.3 percent above last December (108.7). Existing-home sales are forecast to be around 5.54 million this year, an increase of 1.7 percent from 2016, which was the best year of sales since 2006.Email market news to press@inman.com.
Source: click here


